


Figure 6:
Stencil diagram.
|
|
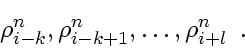
The density
 at grid point
 and time-step
 depends on values at the old time-step
 (direct
numerical domain of dependence,
stencil)
(direct
numerical domain of dependence,
stencil)
 |
(103) |
This is sketched in a so-called
stencil diagram
as in Fig. 6.
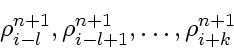
Looking the other way, a stencil diagram tells also which points
 |
(104) |
at the new time-step
are influenced by
 (range of influence).
![\includegraphics[width=7.5cm]{images/pde1d_stencil_mm0pp.ps}](img225.png)