Numerical simulations of a red supergiant
Red supergiant stars (as e.g. Betelgeuse) show irregular brightness
variations on time-scales of weeks, months, and years.
These can even observed with the naked eye, see the
Betelgeuse data and lightcurves
of the
American Association of Variable Star Observers.
With modern interferometers
(e.g. the
Cambridge Optical Aperture Synthesis Telescope
or the
Very Large Array Radio Telescope)
or with the
Hubble Space Telescope
it is possible
to detect time-dependent deviations from the perfect spherical symmetry,
that is commonly assumed for stars.
A stellar wind can transport material from the star into its neighborhood
where it can accumulate in observable shells.
Characteristics of the numerical model
|
Model reference code
|
st35gm04n26
|
|
Star to model
|
Betelgeuse
|
|
Mass
|
5 solar masses
|
|
Radius
|
about 600 solar radii
|
|
Luminosity
|
41400 solar luminosities
|
|
Grid
|
Cartesian cubical grid with 1713 points
|
|
Edge length of box
|
1674 solar radii
|
|
Movie time span
|
7.5 years
|
With the improvement of algorithms that can exploit the ever increasing
computer power,
numerical simulations become a more and more useful tool to
investigate complex dynamical systems in a variety of fields.
Some results of the application to red supergiant stars are presented here.
The coupled non-linear equations of hydrodynamics
and non-local radiative energy transport are solved with
CO5BOLD
on a fixed cubical grid.
Ionisation processes are taken into account.
Acceleration of gravity is given by a prescribed spherical potential.
The potential is smoothed in the center and energy is injected into the
model to mimic the effect of the unresolved stellar core.
The outer boundaries of the box allow the free in- or outward movement
of matter.
The energy produced in a real stellar core by nuclear fusion processes
(and just added to the internal energy in a central part of the model)
is transported to the surface via radiation and convection.
Convective motions close to the surface cause the inhomogeneities.
They emit sound waves that can travel as shocks through the thin
atmosphere of the star.
The following movies (about 4.4 Mbyte each) might give an idea about the
phenomena encountered in the simulations.
You can click on the image on the left (or on the link on the right) to
see the MPEG movie. To get a first impression you might choose the JPEG image
(on the right).
|
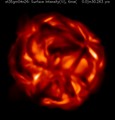
Emergent surface intensity (at left surface of cube in x1 direction).
The intensity movies show the star approximately as it might appear to the human eye
(In detail: The emergent bolometric surface intensity is color coded with the
standard "red-heat" table, to get a color representation adequate for a red supergiant.).
The "boiling" surface of the star shows irregular hot (white or yellow)
and "cool" (red or dark-red) areas.
They change their intensity and shape on time-scales of months.
|
MPEG movie
JPEG image
|
|
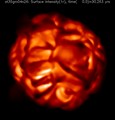
Emergent surface intensity (at right surface in x1 direction).
A view from a different angle.
|
MPEG movie
JPEG image
|
|
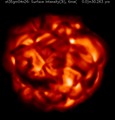
Emergent surface intensity (at left surface in x3 direction).
A view from a another angle.
This view (i.e. left/right, up/down) corresponds best to the
following movies of slices through the star.
|
MPEG movie
JPEG image
|
|
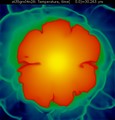
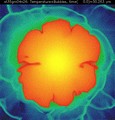
Temperature slice.
The colors of these movie of temperaturs slices through the center of
the stellar model are completely arbitrary:
blue corresponds to about 2000 K (the outer atmosphere),
green to about 3000 K (the photosphere),
red to about 25000 K (layers just within the surface),
and yellow to about 160000 K (the central temperature of the model).
In the very core of a real supergiant the temperatures would increase
to more than 100 Million K -- in a relatively small central region
not included in the simulations.
|
MPEG movie
JPEG image
|
|
Temperature slice and "bubbles" that follow the flow.
For this movie "bubbles" (some noise in the color table) have been superposed
to the temperature to mark the actual flow of matter.
Cool (red) downdrafts with high convective velocities can transport matter
from the surface deep into the envelope.
In the outer atmosphere (blue) shock waves (green) are frequent.
|
MPEG movie
JPEG image
|
|
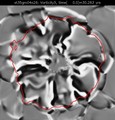
Vorticity slice.
The convective velocities in the stellar envelope can be nicely seen
in this movie of the vorticity (black means clockwise motion,
white indicate counter-clockwise flow).
The approximate location of the visible stellar surface is marked by
the red line.
There are a few long-lived downdraft regions spanning almost the
entire envelope.
However, some short-lived convective cells are restricted to the
surface layers only.
|
MPEG movie
JPEG image
|
|
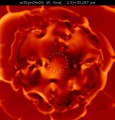
Slice of pressure fluctuations.
The instationary convective flow produces pressure fluctuations that travel as sound waves
in the stellar interior and transform into shocks in the photosphere.
The dashed circle marks the "core" of the model where energy is injected.
Note, that the amplitudes of the waves are much smaller in the interior
than in the atmosphere: for the movie they have been scaled properly
to make them visible everywhere.
The waves travel very fast in the center because of the high sound speed
due to the high temperature in these region.
|
MPEG movie
JPEG image
|
|
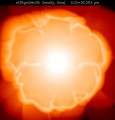
Density slice.
The density decreases from the center to the surface, has a local
maximum there (the irregular bright-organge "ring") and drops rapidly
outside. However, shock waves are capable of ejecting material from
the surface into the atmosphere.
Further models with larger extension should show if the matter can
actually leave the star.
|
MPEG movie
JPEG image
|
Back to
Bernd Freytag's homepage.


