 |
| Home | Contacts | People | Research | Education | Observatory | Resources | Popular | Library | Webmaster |
|
|||||||||||
|
|||||||||||
| Daytime UBVRI photometry |
| Telescope setup | The telescope was equipped with the sub-aperture mask and the tube sock which blocks unwanted light. A tube with 8cm aperture was mounted in the lower right aperture hole of the mask. The tube consisted of the 10cm white external tube (with internal 8cm rings installed) and an internal paper tube (also 10cm with internal 8cm rings) reaching about 50cm behind the aperture mask. The ST1001-E camera was used with the 2:nd set of UBVRI filters installed in the internal filter wheel. The CCD was held at -15 degrees. The dome was placed so that the top of the white tube was always in shadow. | Observation
|
The sky was roughly 40% covered with cumulus when the photometry observations was started around 14:30 UT. The first strategy was to select a star and wait for clear sky, but after two interrupted imaging runs (each star was taken in the sequence UBVRI in each frame of a 4x4 mosaic) the strategy was changed to point towards a clear part of the sky not to close to the Sun and look for a nearby bright star (with photometry present in Johnson et al. (1966)). The mosaics were also reduced to 3x3. All filter was exposed in 0.5s except U which had 5s exposures. This was selected so that the background was sufficiently high at the same time as the star should not be saturated independent of altitude and angular distance to the Sun. A short exposure time could introduce artifacts from the shutter. However, nothing obvious was seen in the images. During the exposure the sky was monitored by eye and through the search telescope. Because of the small aperture which made the f-ratio high (roughly f/112.5), and the short exposure times, any cloud could easily be seen in the images and discarded in the later reduction process. In total 8 stars were observed (see Table 1 in chronological order). Since only one star at the time was imaged the angle relative to the telescope was kept at all time in order to make the flatfielding easier. |
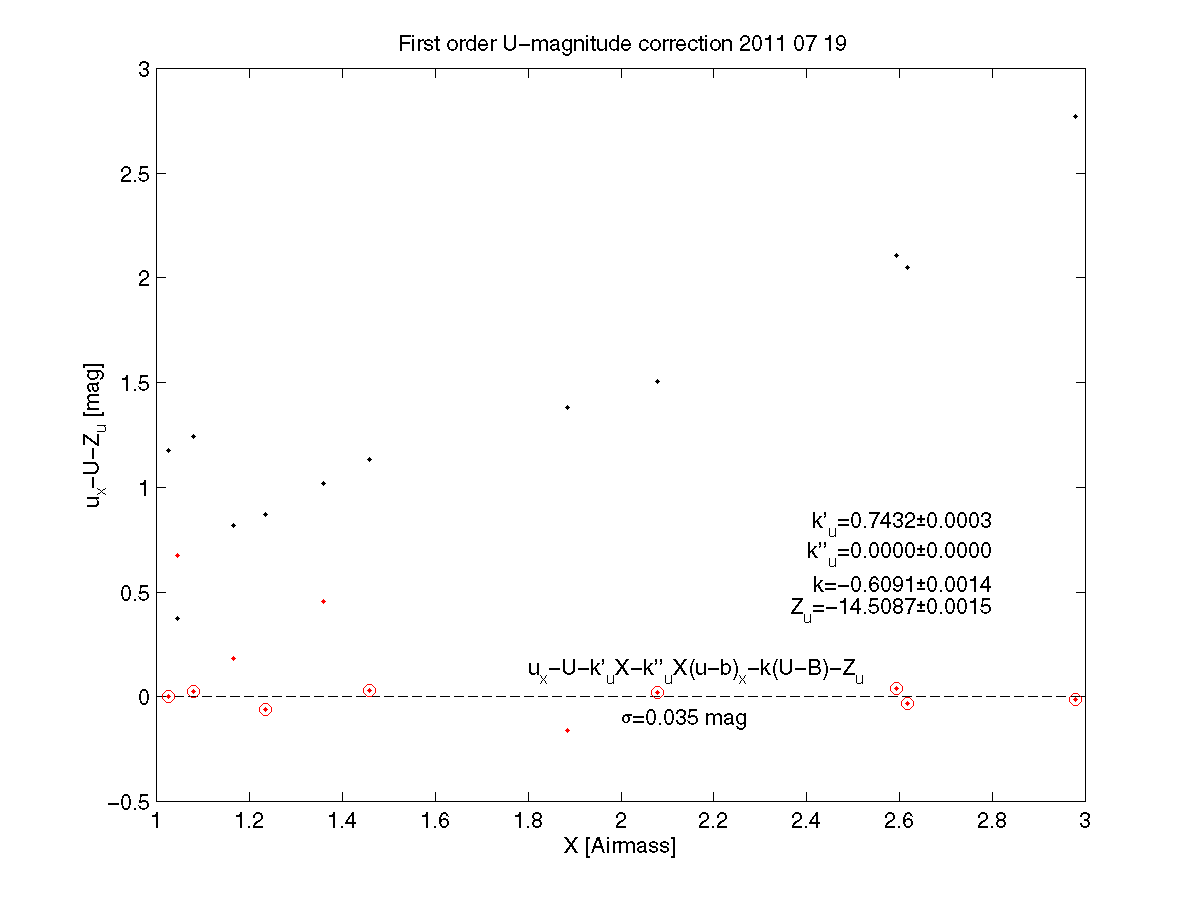
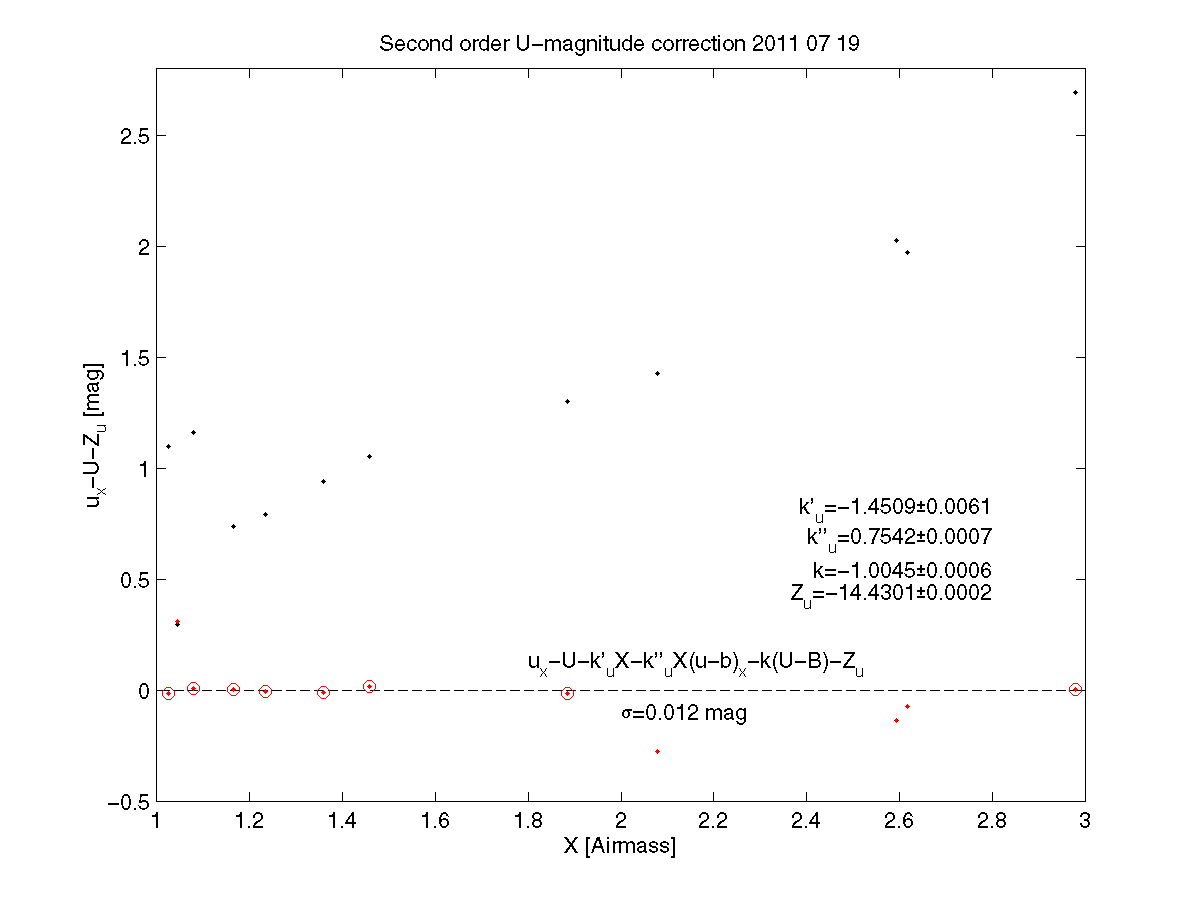
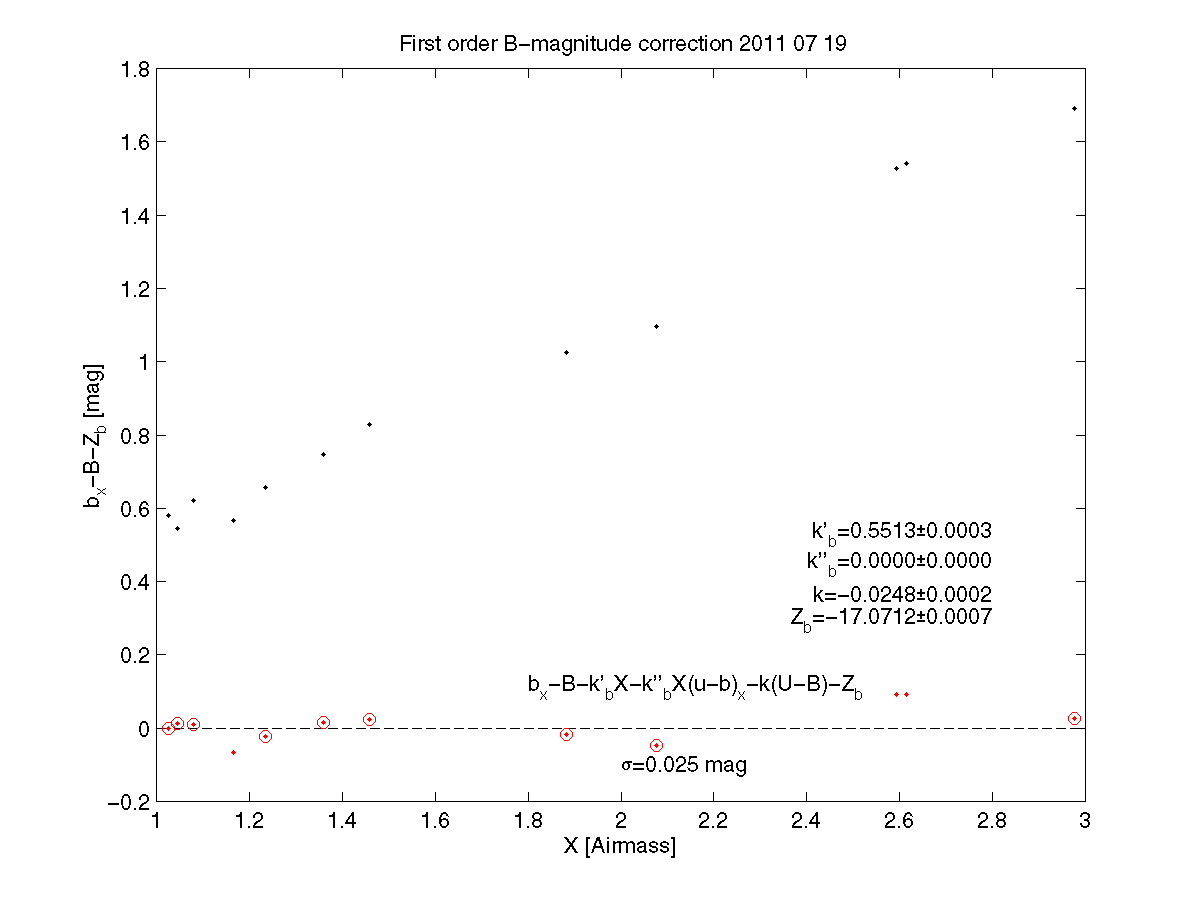
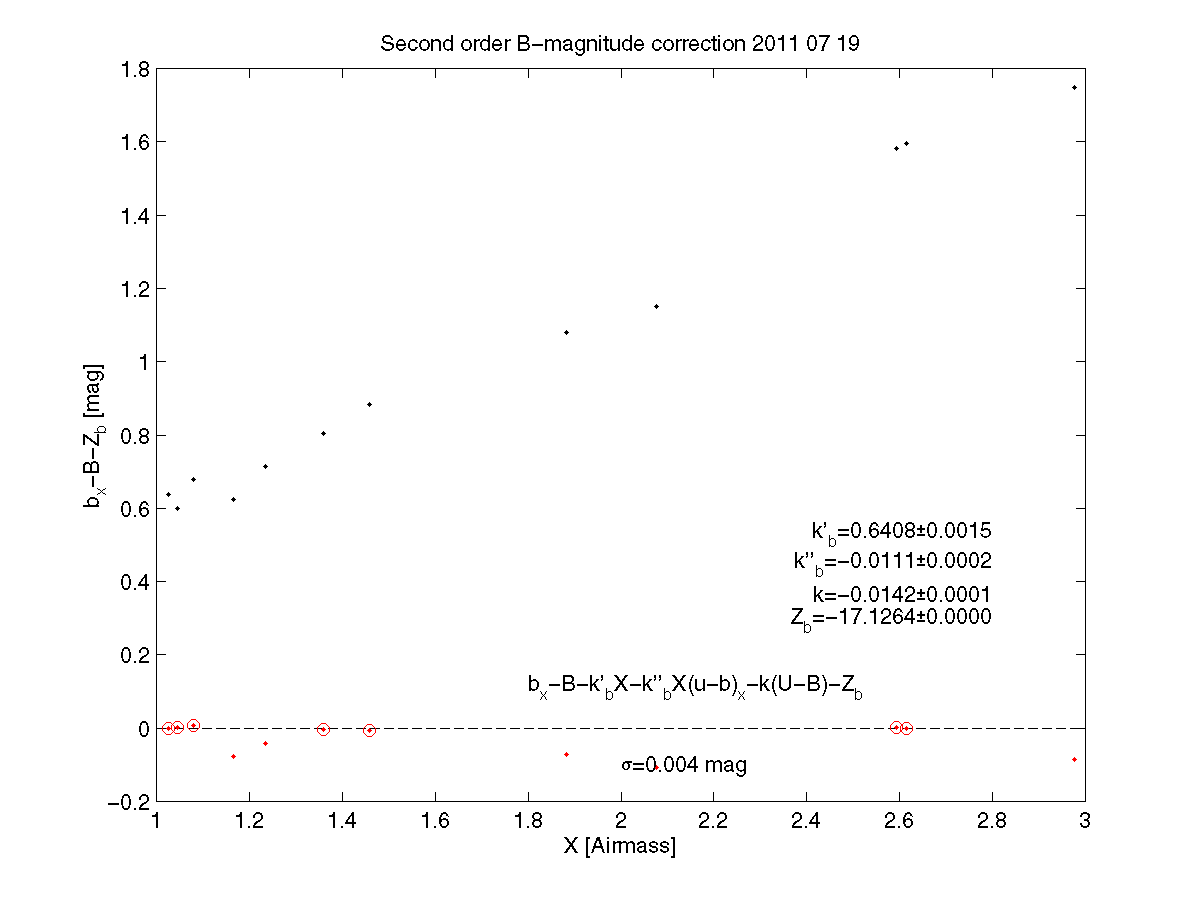
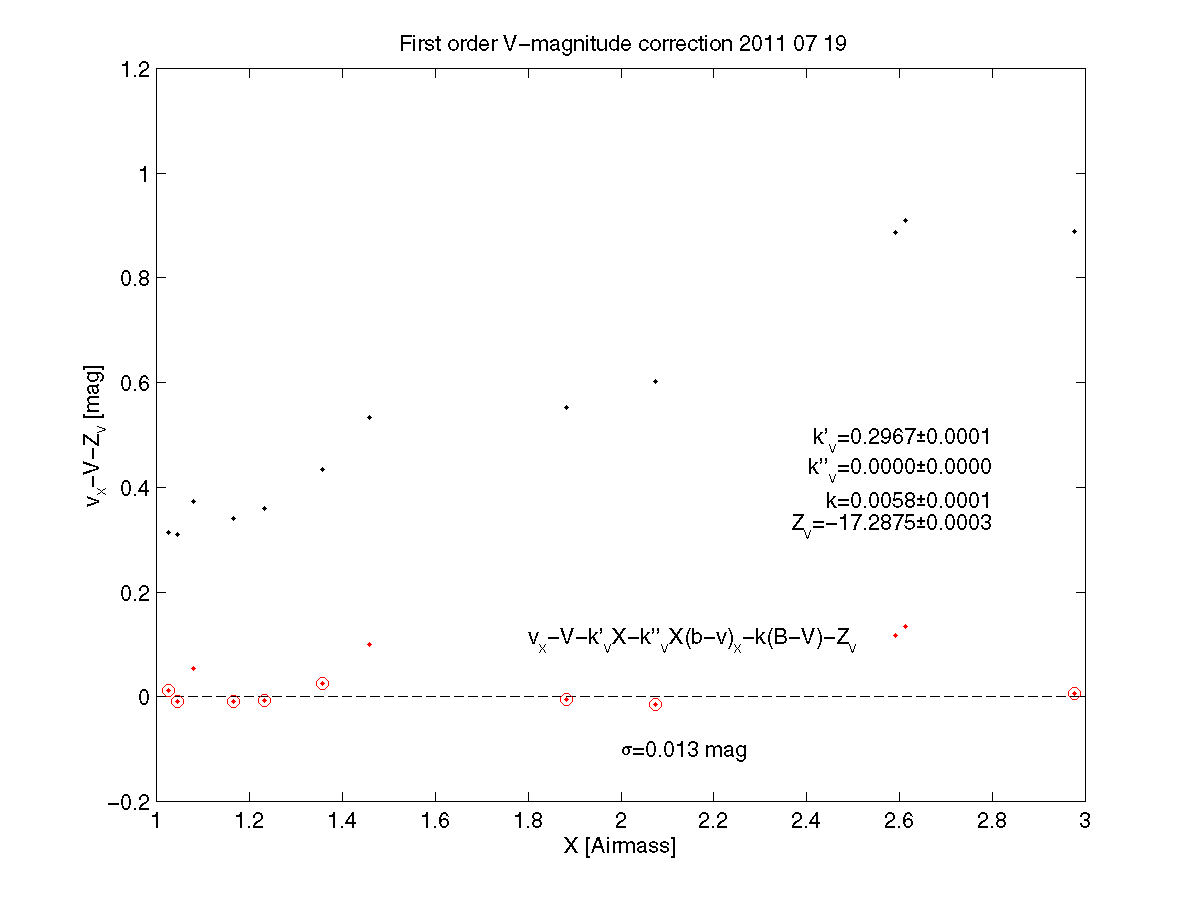
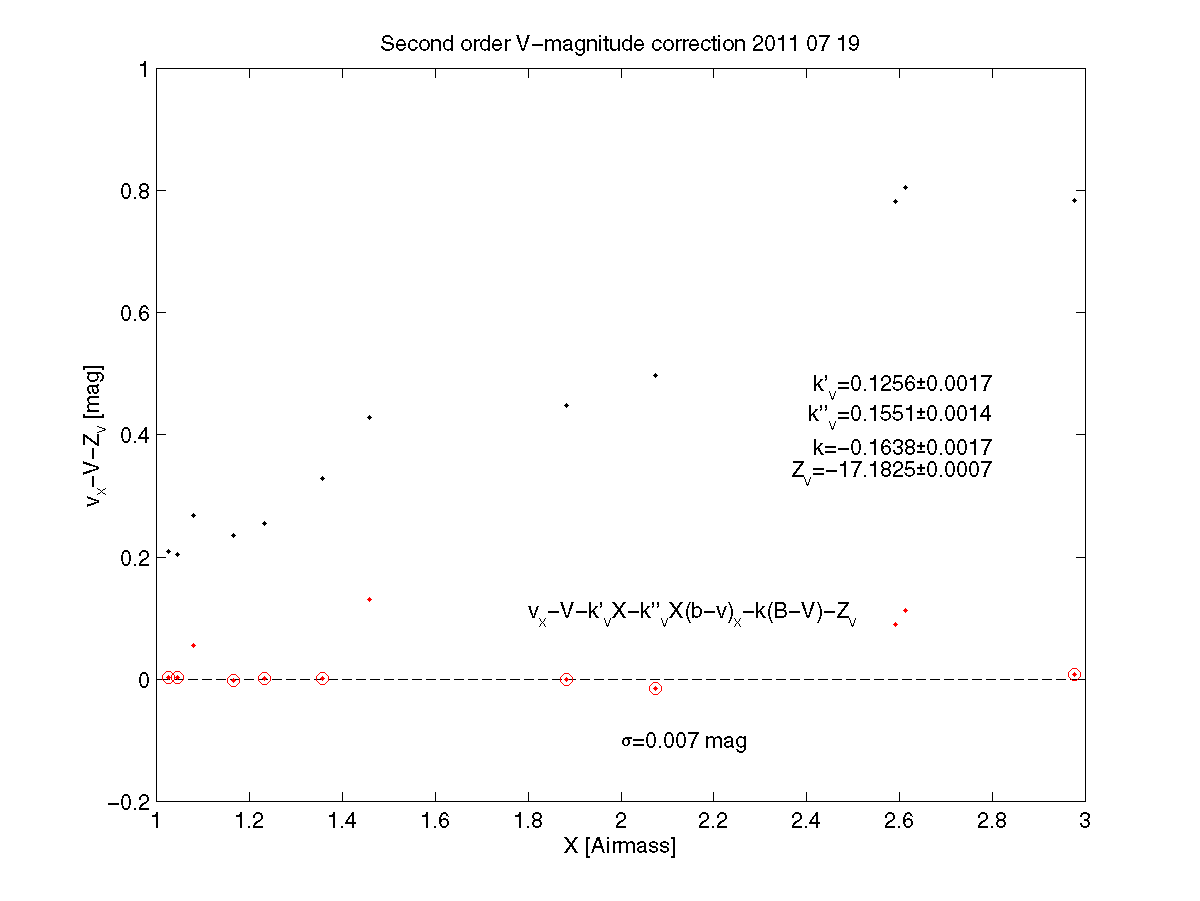
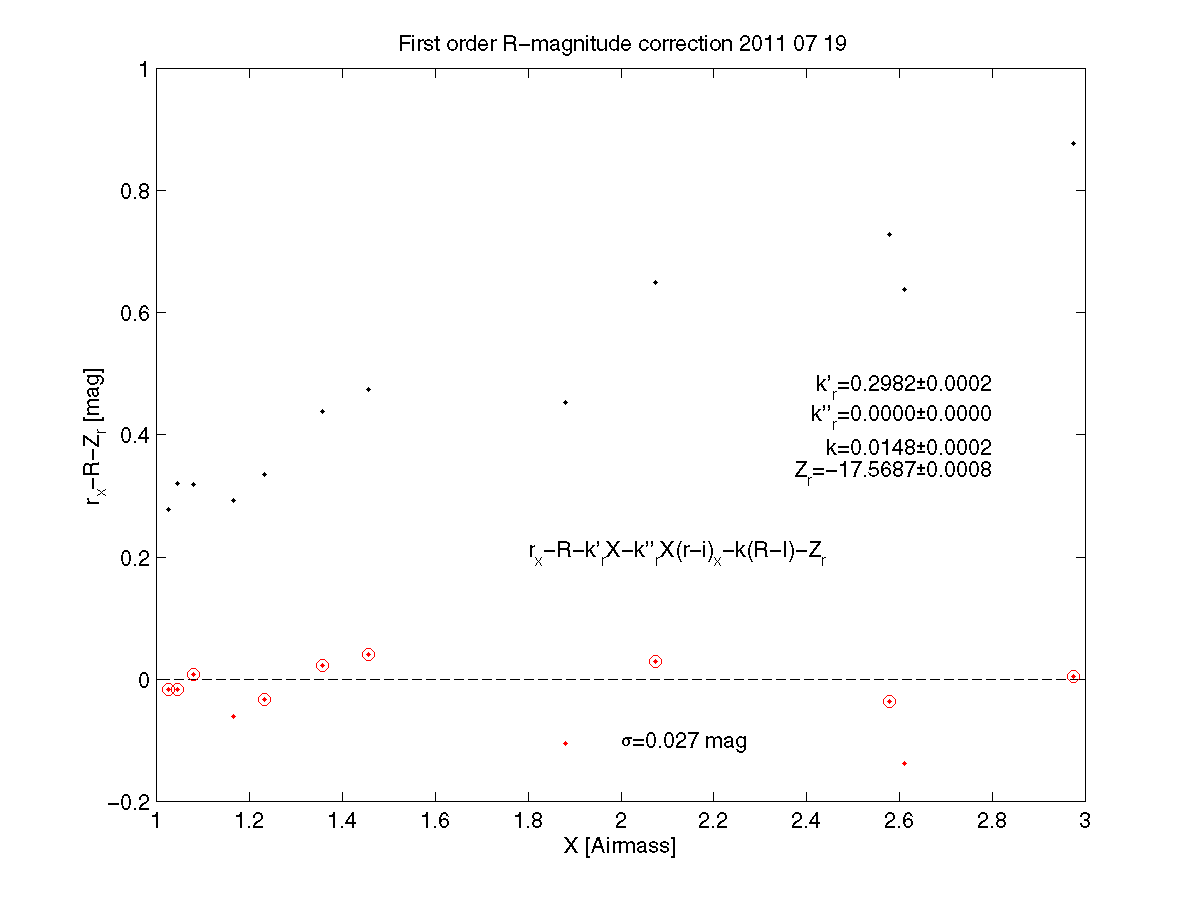
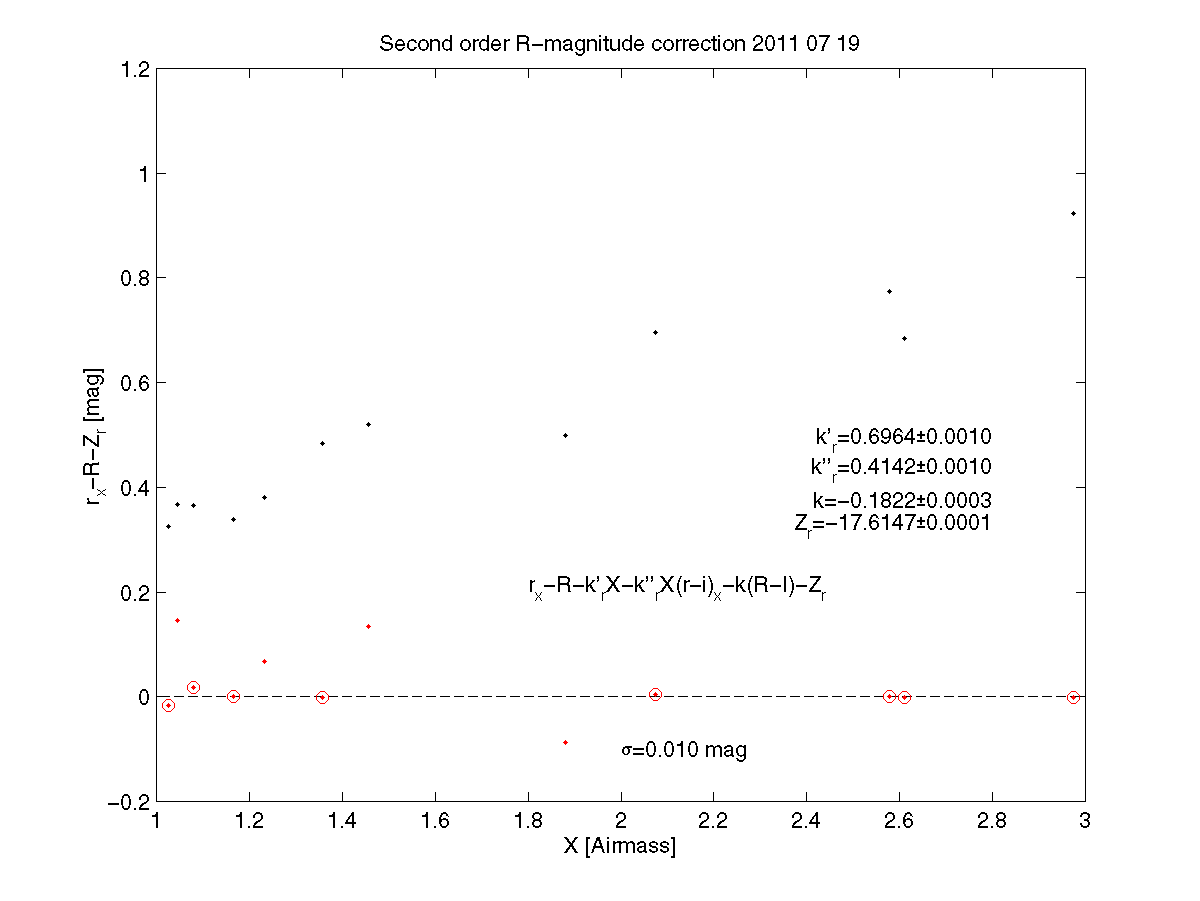
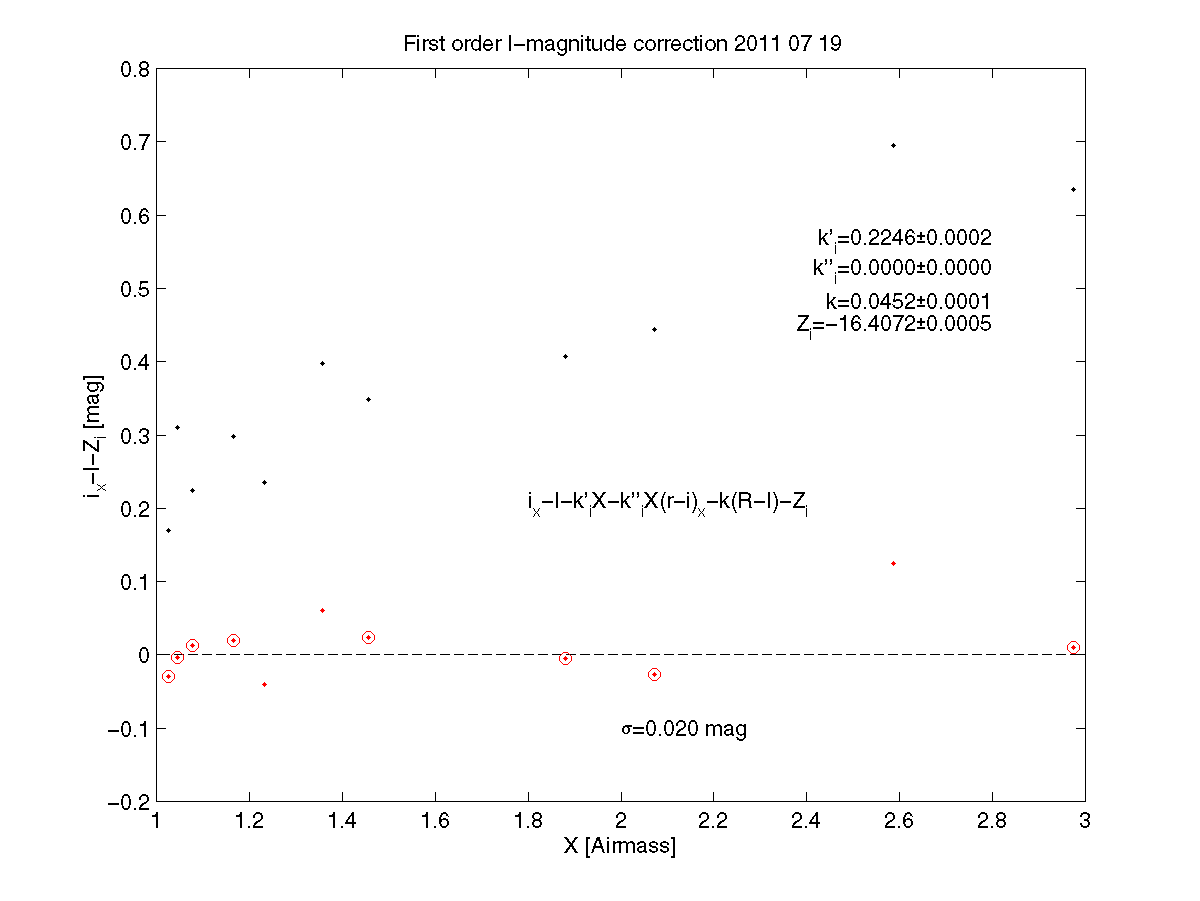
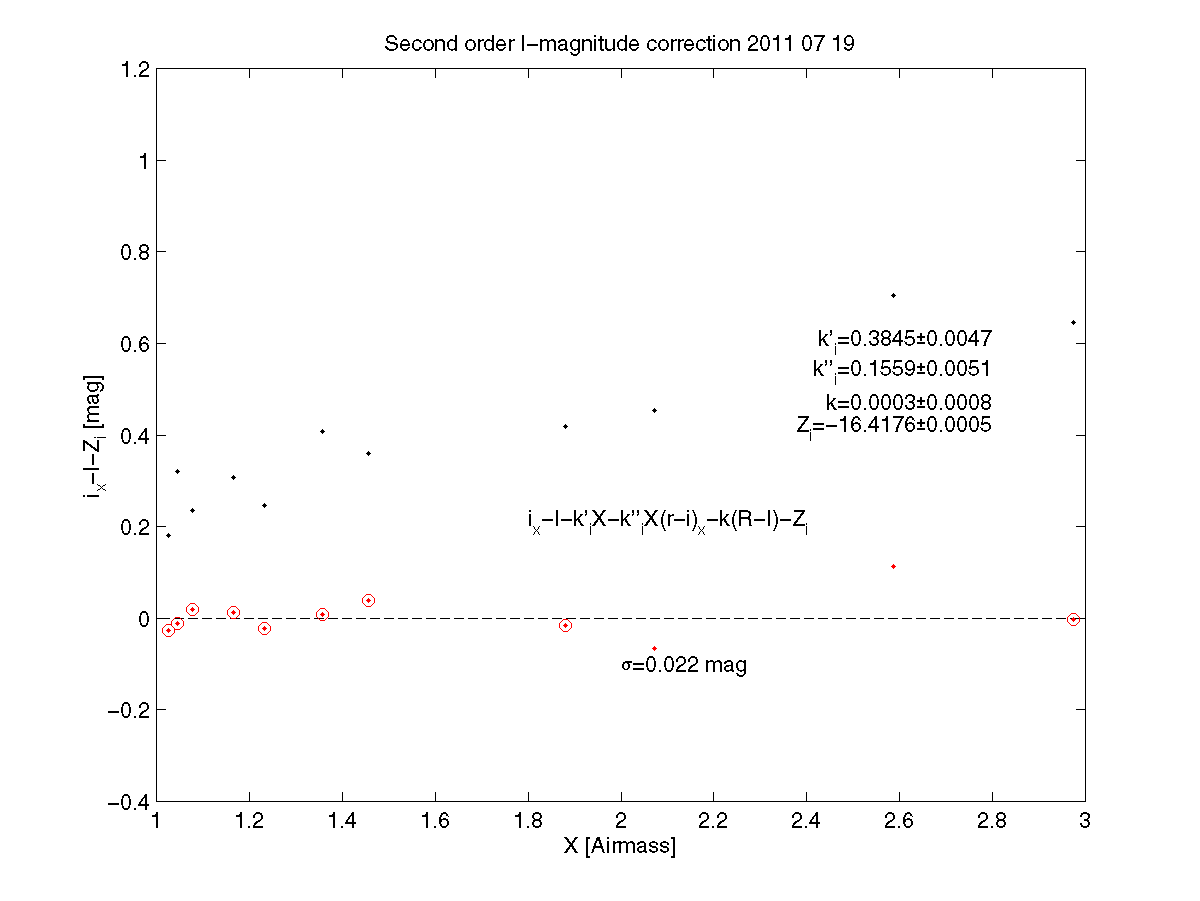
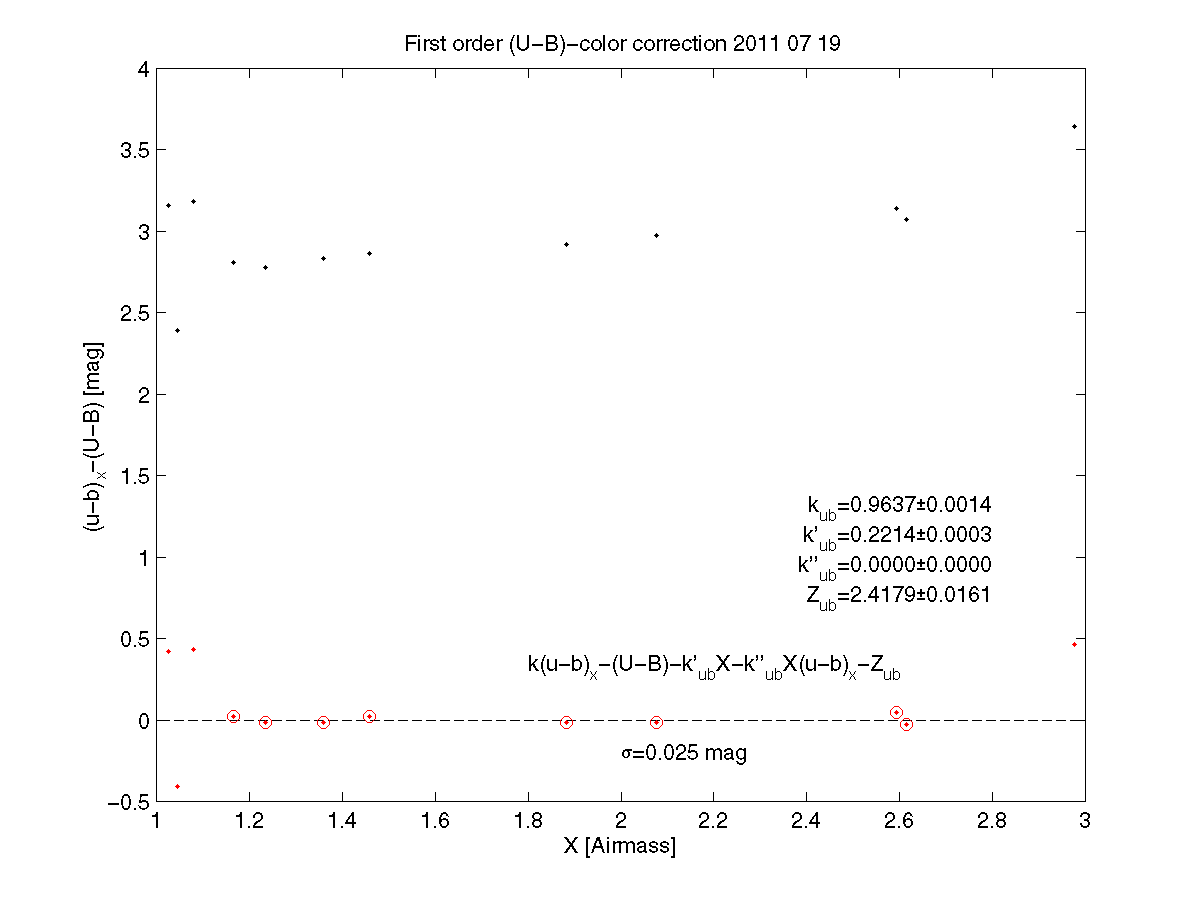
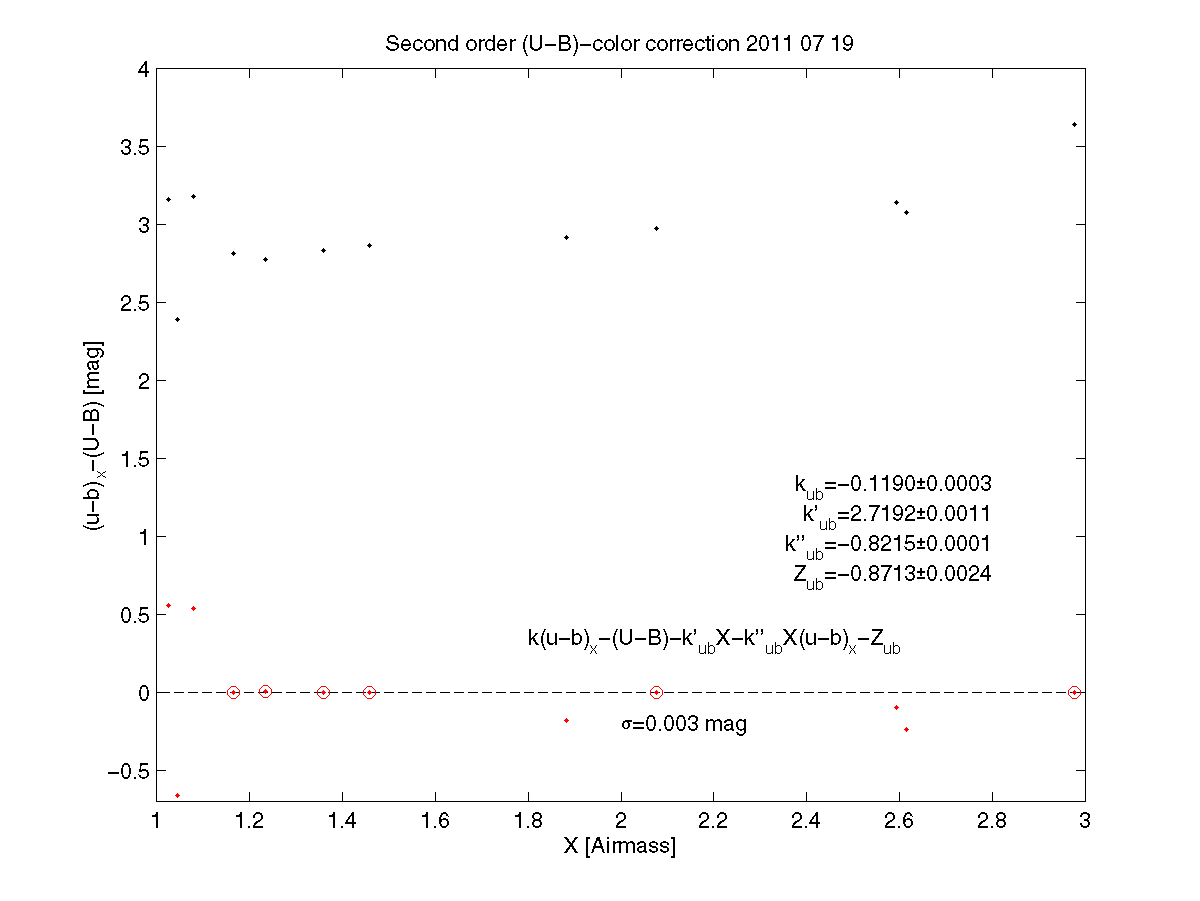
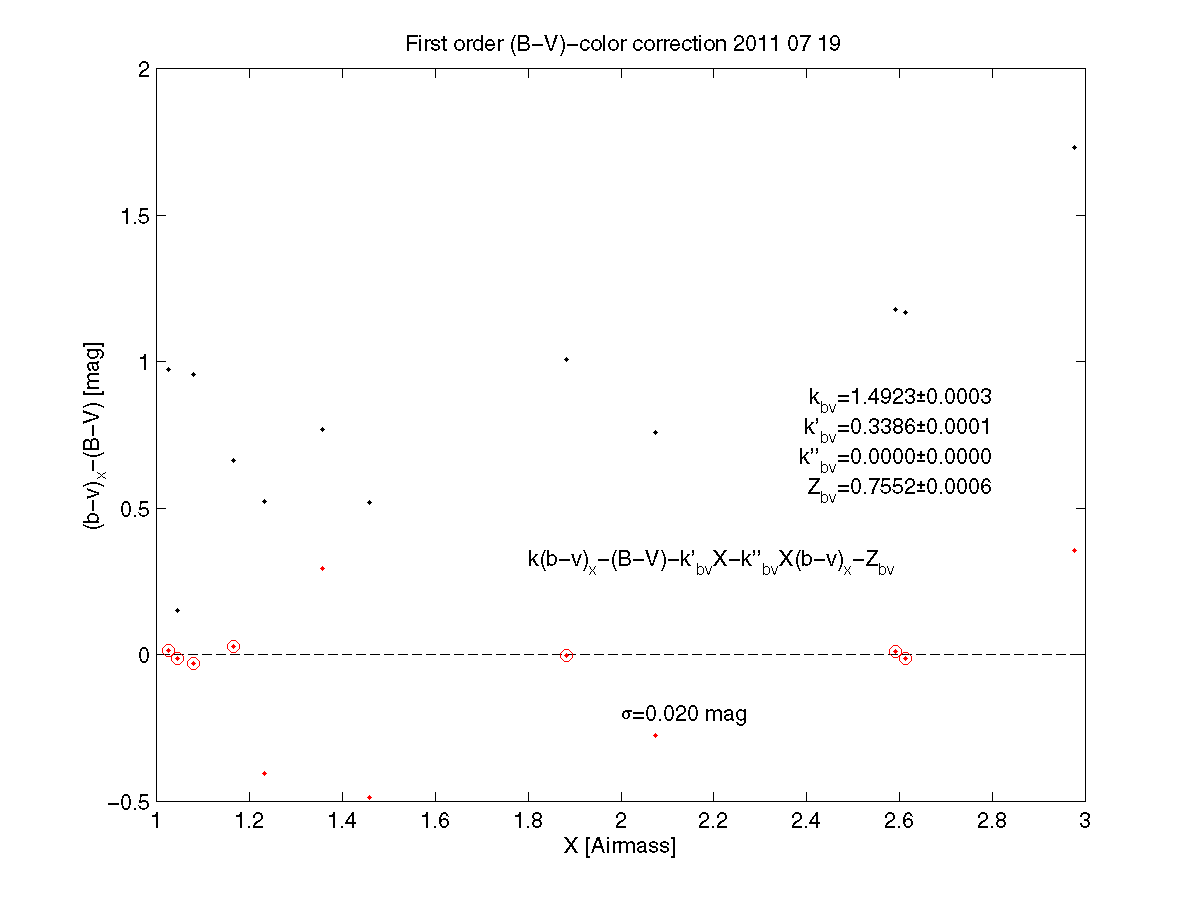
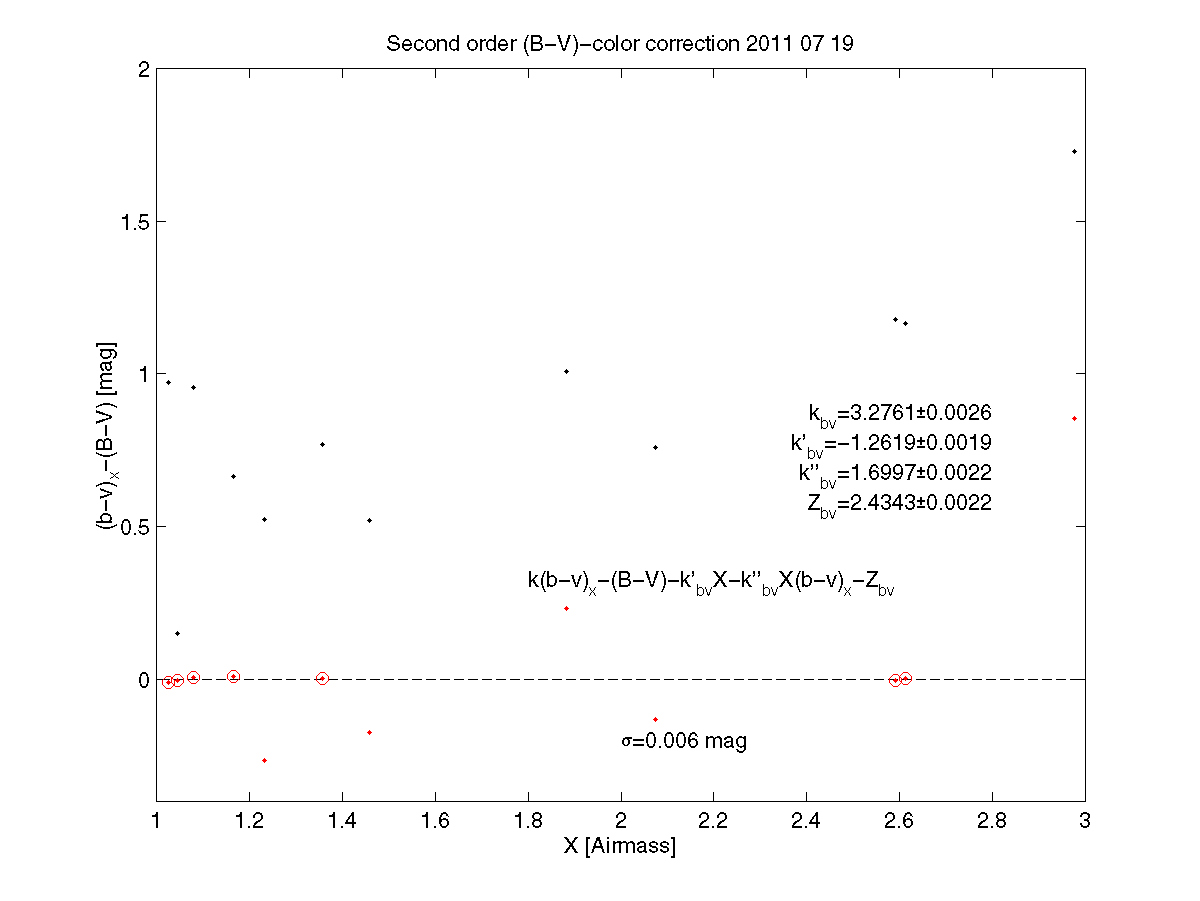
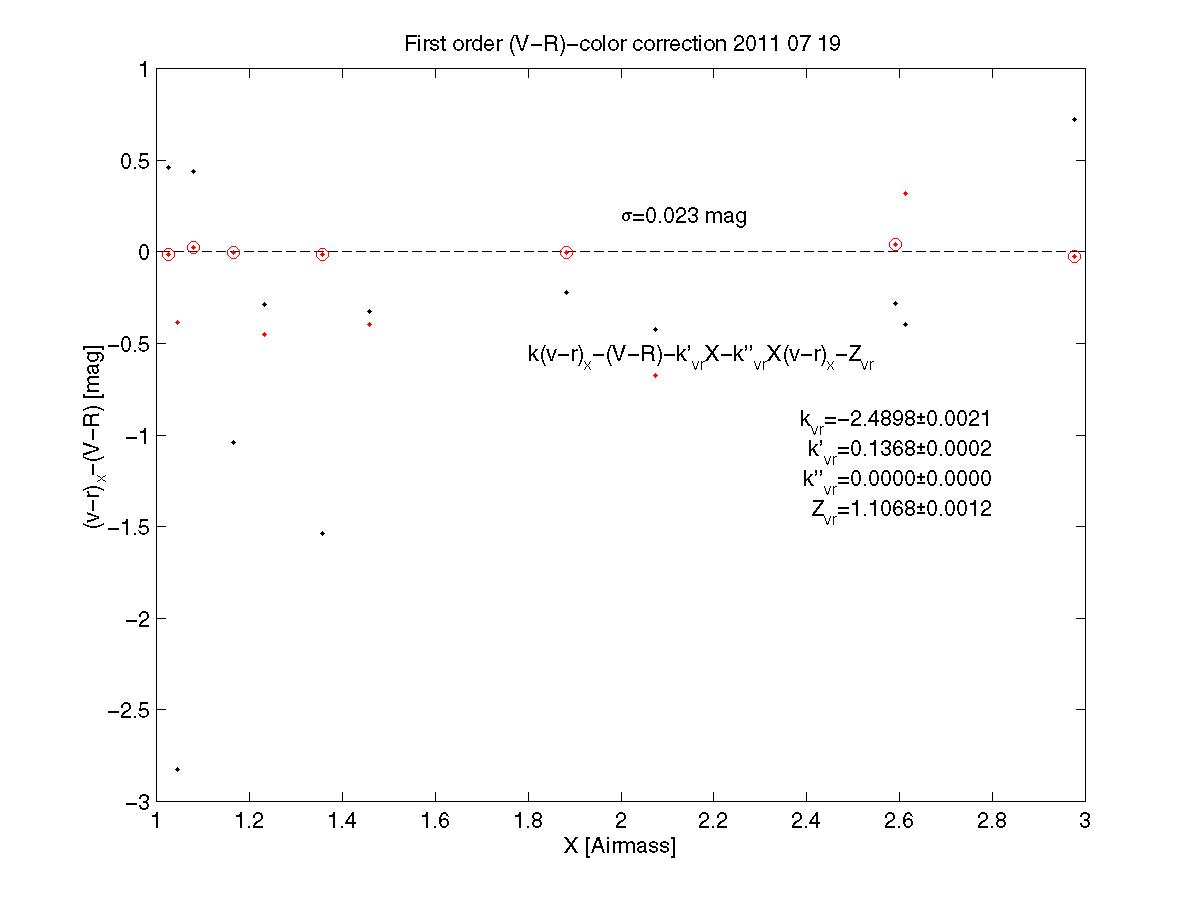
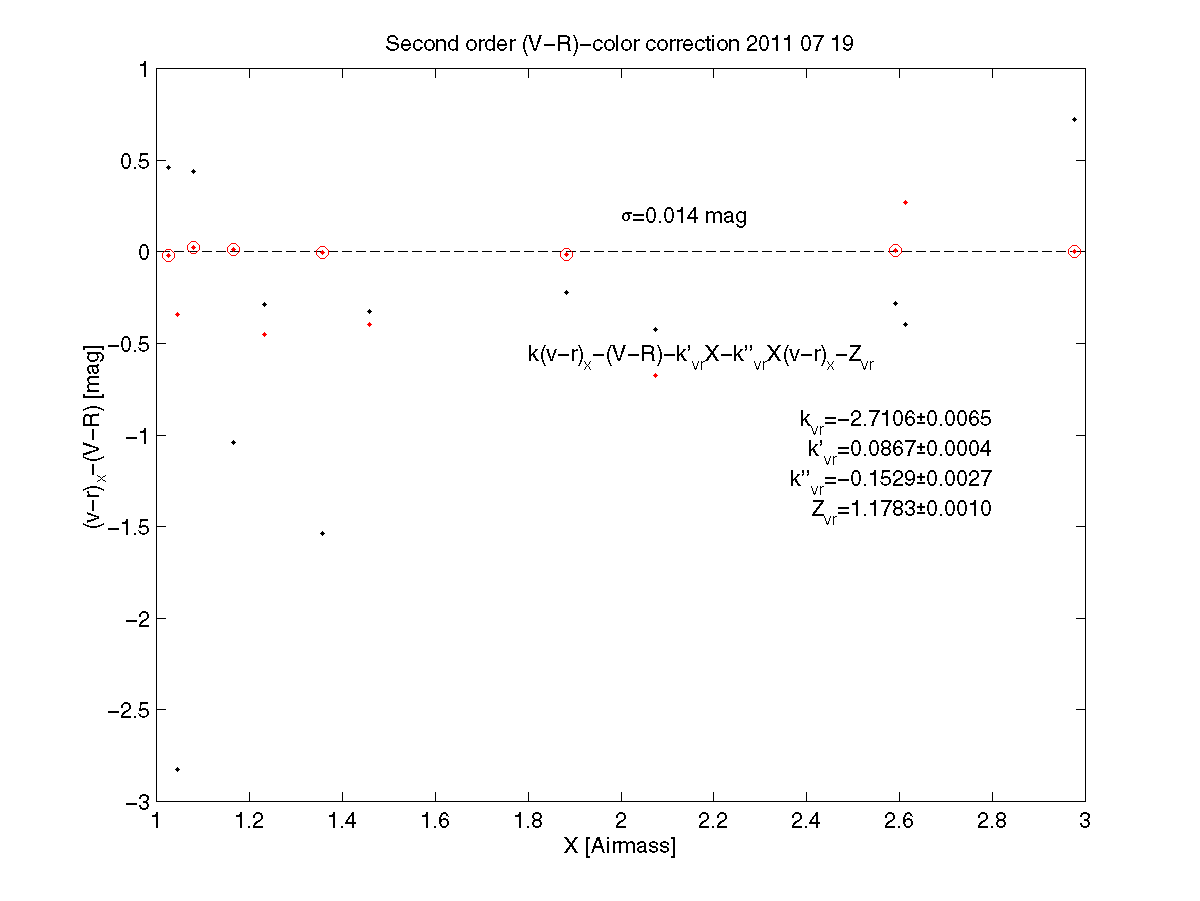
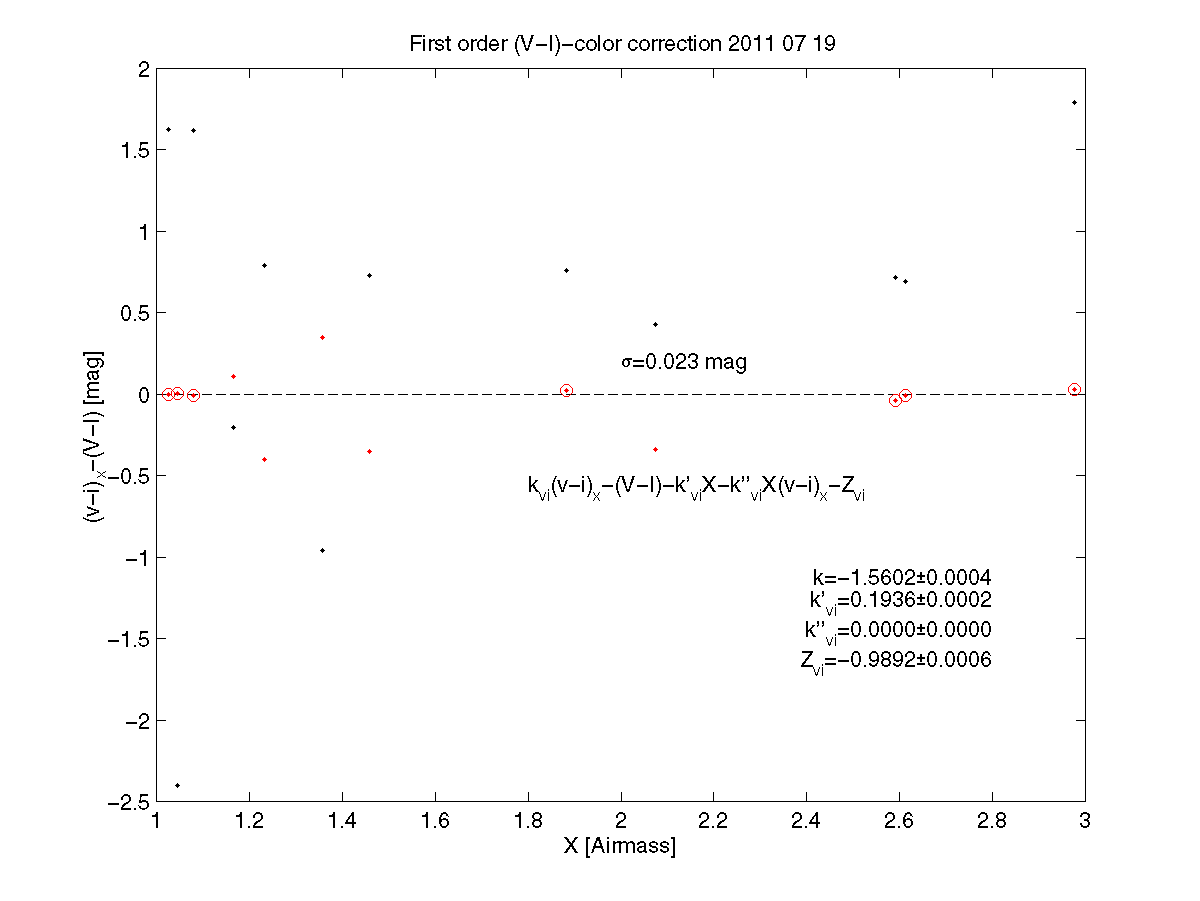
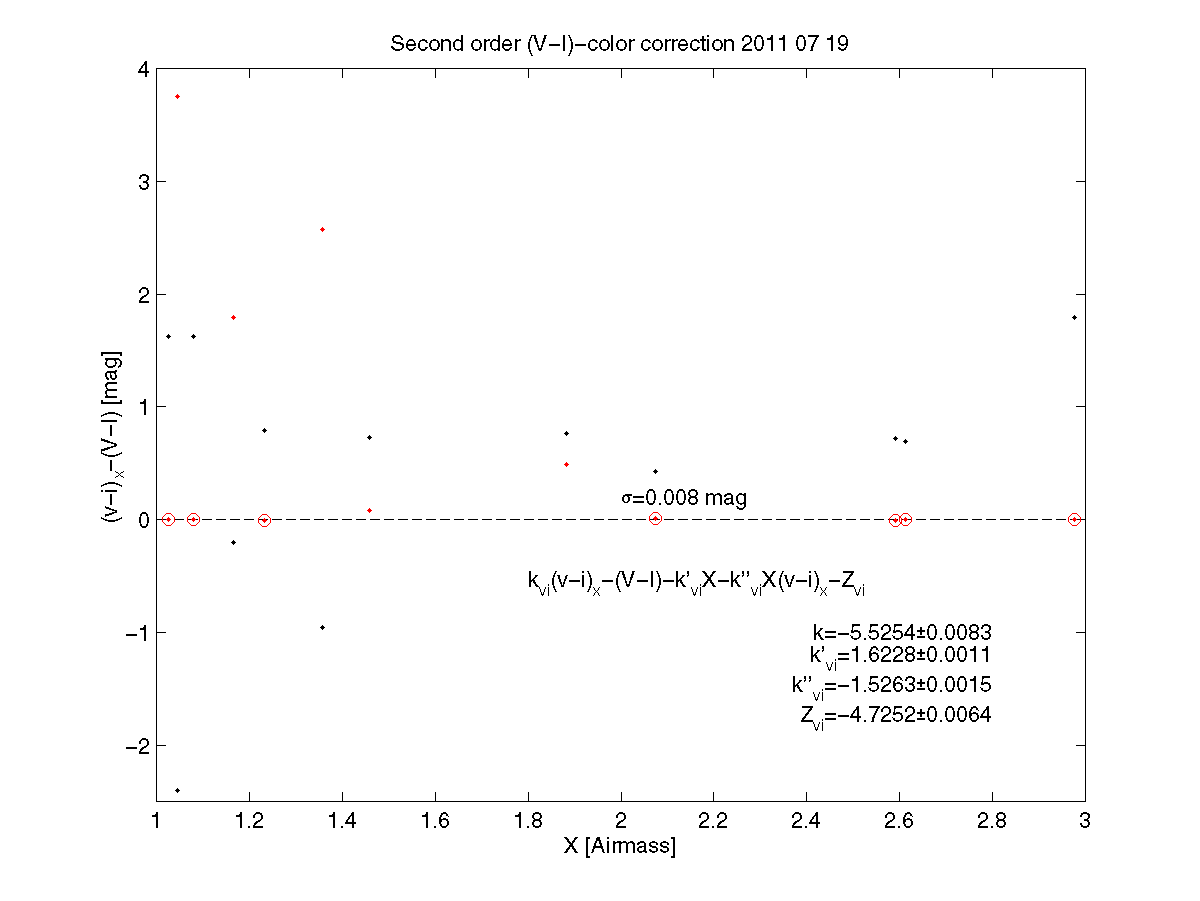
Reduction | Bias and dark were removed with dark frames with the same exposure times as the science frames. Because of the high f-ratio all dust on filter and CCD window were almost focused. This posed a problem since the filters were changed for each frame in the mosaic and the filter position was not reproduced exactly. However, since the angle relative to the telescope was kept it was possible to use images from all stars in one filter and selecting them into subgroups with close to the same dust position. About 80 images in each filter could then be divided among some 5-8 subgroups. If the subgroup contained 6 or more images they where normalized, and median combined. The resulting flats were used to flat field the images in respective group. The only significantly deviating background found was in the Kochab I-filter. The cause is unknown but a possible explanation is some direct sunlight into the outer tube which has its inside covered with a black cloth which is known to be non-absorbent in I. After that the images were sorted with respect to filter and mosaic run, aligned to the star and averaged combined. Thus photometry for the stars in Table 1 down to Izar is based on 1-4 combined images, the first Alphecca run has 13-14 images combined, and the rest 7-9 images. The FWHM was around 4-6 arcsec in the combined images. A photometric aperture of 12.1 arcsec was used and the background ring had a thickness of 5.5 arcsec. The gap was in most cases 2.75 arcsec but in a few cases a gap of 8.8 arcsec were used in order to avoid obvious artifacts from the imperfect flat fielding. Along with the ADU counts of the star the background counts. Table 2 shows typical values and the range of values. The lowest values were found at combinations of high altitude, low solar altitude, and great solar distance. The highest values were found at the opposite combinations. Since the standard photometric values for the stars were given in Johnson R-, and I-filter, those were first converted into Cousins R, and I-filter (Taylor 1966) (V-R)C=0.717((V-R)J-C2)-0.021 (Eq. 1) d(V-R)C=((d(V-R)J0.717)2+(dC20.717)2)1/2 (Eq. 2) (V-I)C=0.902((V-I)J-(V-R)J-C1)-0.087dBJ+0.073+(V-R)C (Eq. 3) d(V-I)C=((d(U-B)J0.087)2+(d(B-V)J1.378*0.087)2+(d(V-R)J0.717)2+(d(R-I)J0.902)2+(dC10.902)2+(dC20.717)2)1/2. (Eq. 4) In the transformation VC=VJ is assumed. Furthermore, C2=-0.018±0.002 if B.C.>4700 otherwise 0, and C1=-0.009±0.002 if 5400<B.C.<7200 otherwise 0. The Balmer-jump correction is calculated by dBJ=(U-B)J-1.378(B-V)J+0.709. (Eq. 5) In order to convert the background ADU counts into UBVRI magnitudes two steps were done. First the ADU was converted into electrons and magnitudes by mb=-2.5log10(gIb)+2.5log10(ts2), (Eq. 6) where mb is the instrumental magnitude in mag/arcsec, g is the gain in electrons/ADU and Ib is the background counts in ADU/pix, t is the exposure time in seconds, and s is the pixel size in arcsec/pix. The second step is to subtract the zero point Z of the filter. However, in order to do that the stars must be used which means that the atmosphere must be taken into the calculation. The magnitude M of a star above the atmosphere is M=mX-km'X-km''XcX-kmC-Zm, (Eq. 7) where mX=-2.5log10(IXg/t) is the telescope magnitude converted from the flux count IX ADU and normalized to one second, km' is the first order extinction coefficient (mag/airmass), X is the airmass, km'' is the second order extinction coefficient (1/airmass), cX is a telescope color (mag) nearby the filter wavelength, km is a correction to the standard system, C is a atmosphere corrected color, and Zm is the zero point. A color can be determined in a similar manner by C=kcX-kc'X-kc''XcX-Zc. (Eq. 8) The uncertainties for the background is then |
Result | Different combinations of stars were tested and sets were chosen as a compromise between many stars and low formal uncertainty in the parameters. Ideally all stars should end up with zero residuals (red dots in the plots). However, they do not for several reasons e.g. all of the stars are reported to be variable, the flat fielding might not have been successful enough, and the sky condition can have changed. Three stars have more than one entry and these can be used to evaluate if the parameters give a reasonable solution. For some reason the single filter solution are more consistent and thus are given in the final Table. The extinction parameters are given in Table 3. At the bottom of Table 3 entries with all stars are also included. Since the magnitudes in the final Table is only Eq. 6 with Z subtracted the other solutions can be tested by adding the original Z and subtracting the new one. However, it is apparent from Table 3 that the difference will be small.
|
References | Johnson, Mitchell, Iriante & Wisniewski, 1966, UBVRIJKL photometry of the bright stars, Com LPL, 4, 99 Taylor, 1986, Transformation equations and other aids for VRI photometry, AJ, 60, 577 |
| Last update : |