 |
| Home | Contacts | People | Research | Education | Observatory | Resources | Popular | Library | Webmaster |
|
|||||||||||
|
|||||||||||
| Shutter delay 2012 11 15 |
| Telescope setup | The telescope was equipped with the 80cm aperture mask because of flatfield tests prior to this shutter test. The tube sock was used for the same reason. The upper and lower hatches were opened but no side doors. The ST1001-E camera was used with an open position installed in the internal filter wheel. The CCD was held at -30 degrees. The F/10 setting of the left telescope focus was used. | Observation | The sky was clear and the ambient temperature was +5 degrees and the moon had set. The shutter observations started at 15:57 UT and lasted until 16:29 UT. The telescope was pointing south at about an altitude of 75 degrees. Two shutter series were taken. For the first series the camera was held at a telescope angle of 90 degrees i.e. the camera was almost upside down. The second series was taken with an angle of 270 degrees. This was done in order to see if the orientation of the camera could have an impact on the shutter delay. All 16 slots in the sequence table in MaxImDL were used in each series. The exposure times was taken in the order 10, 9, 8, 7, 6, 5, 4, 3.5, 3, 2.5, 2, 1.5, 1.2, 0.8, 0.5, 0.2 seconds. Each exposure time was taken five times in order to get an estimate of the scatter. The observed area was selected to have enough stars of different magnitudes so that both faint and bright stars could be measured in both the 0.2 and 10 second images. It was of interest to see if the bright stars suffered from none linearity of the CCD at high ADU:s. The south direction and altitude was chosen so that the airmass should be low and not change much during the observations. The rotation 90 field has an approximate center of R.A. 20 43 20 DEC. +44 58 30 J2000. However, since the rotation axis is not in the center of the CCD the rotation 270 field is shifted about 1'. The angle relative to the telescope was changing slightly during the observation because the field rotation was kept at all time and no reset was made between the images. |
Reduction
|
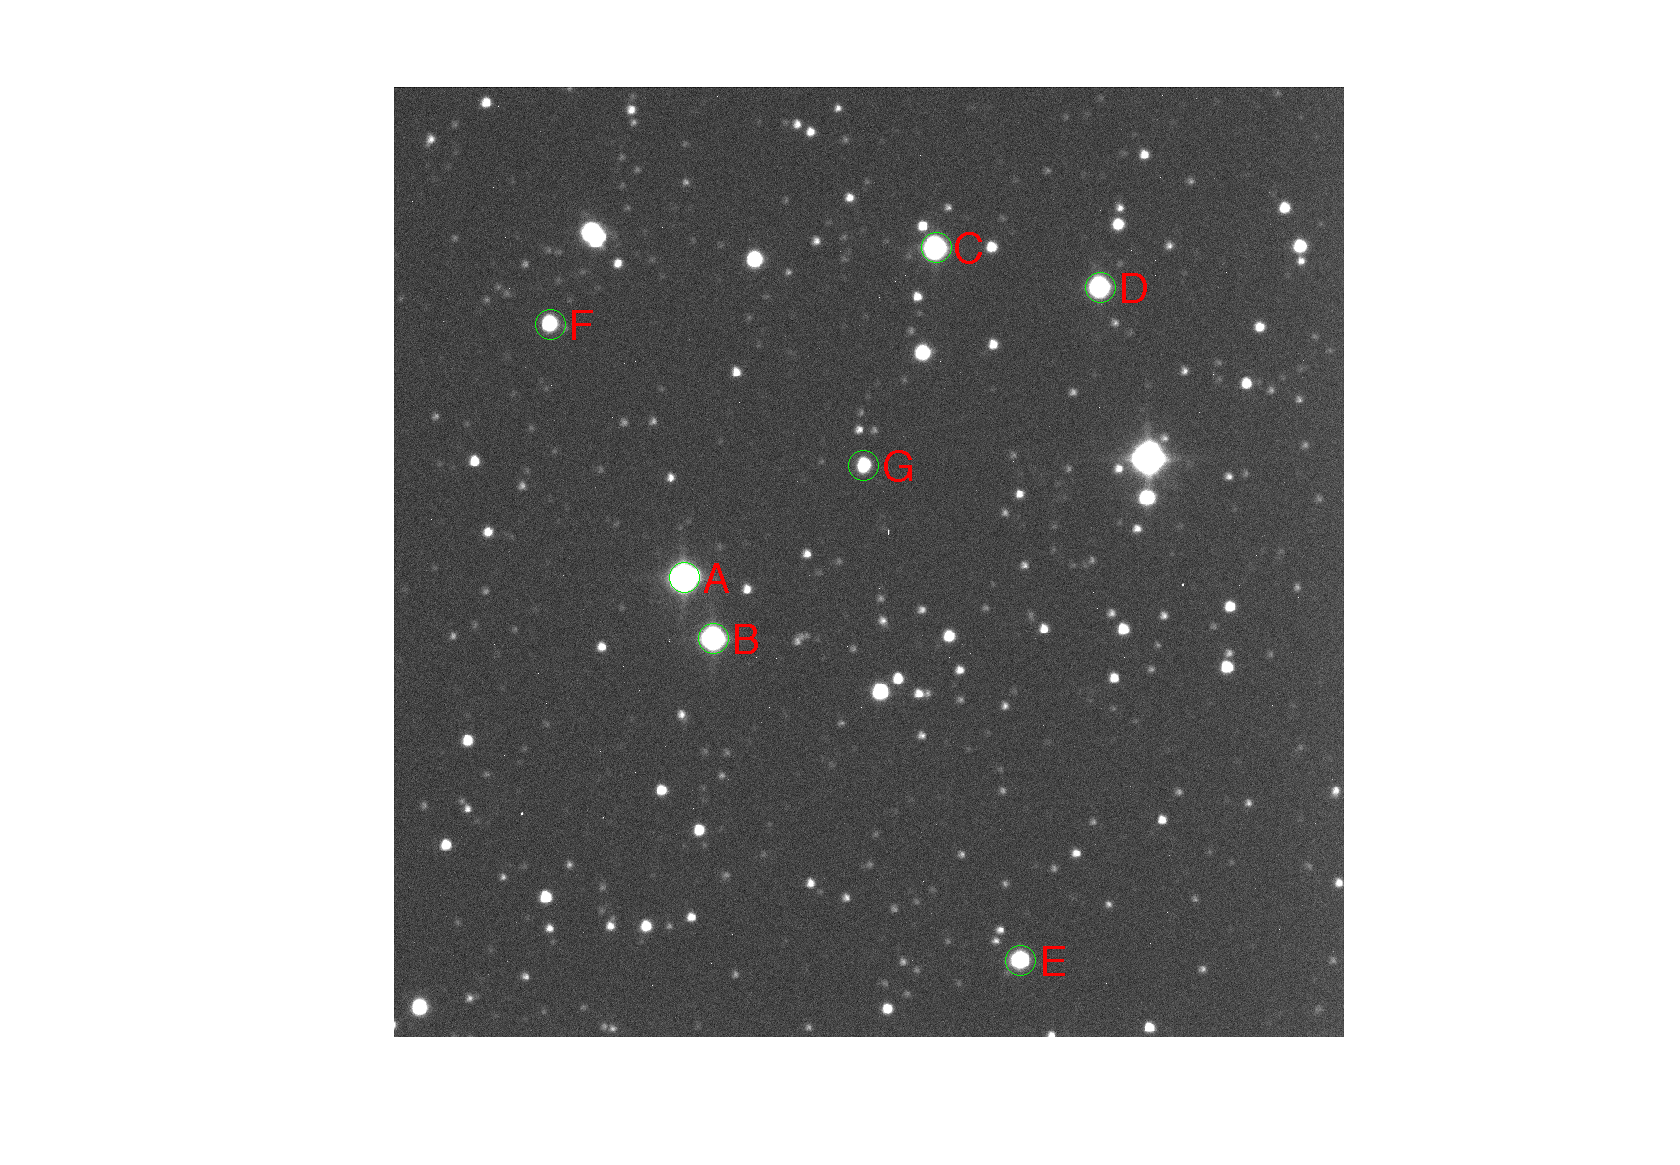
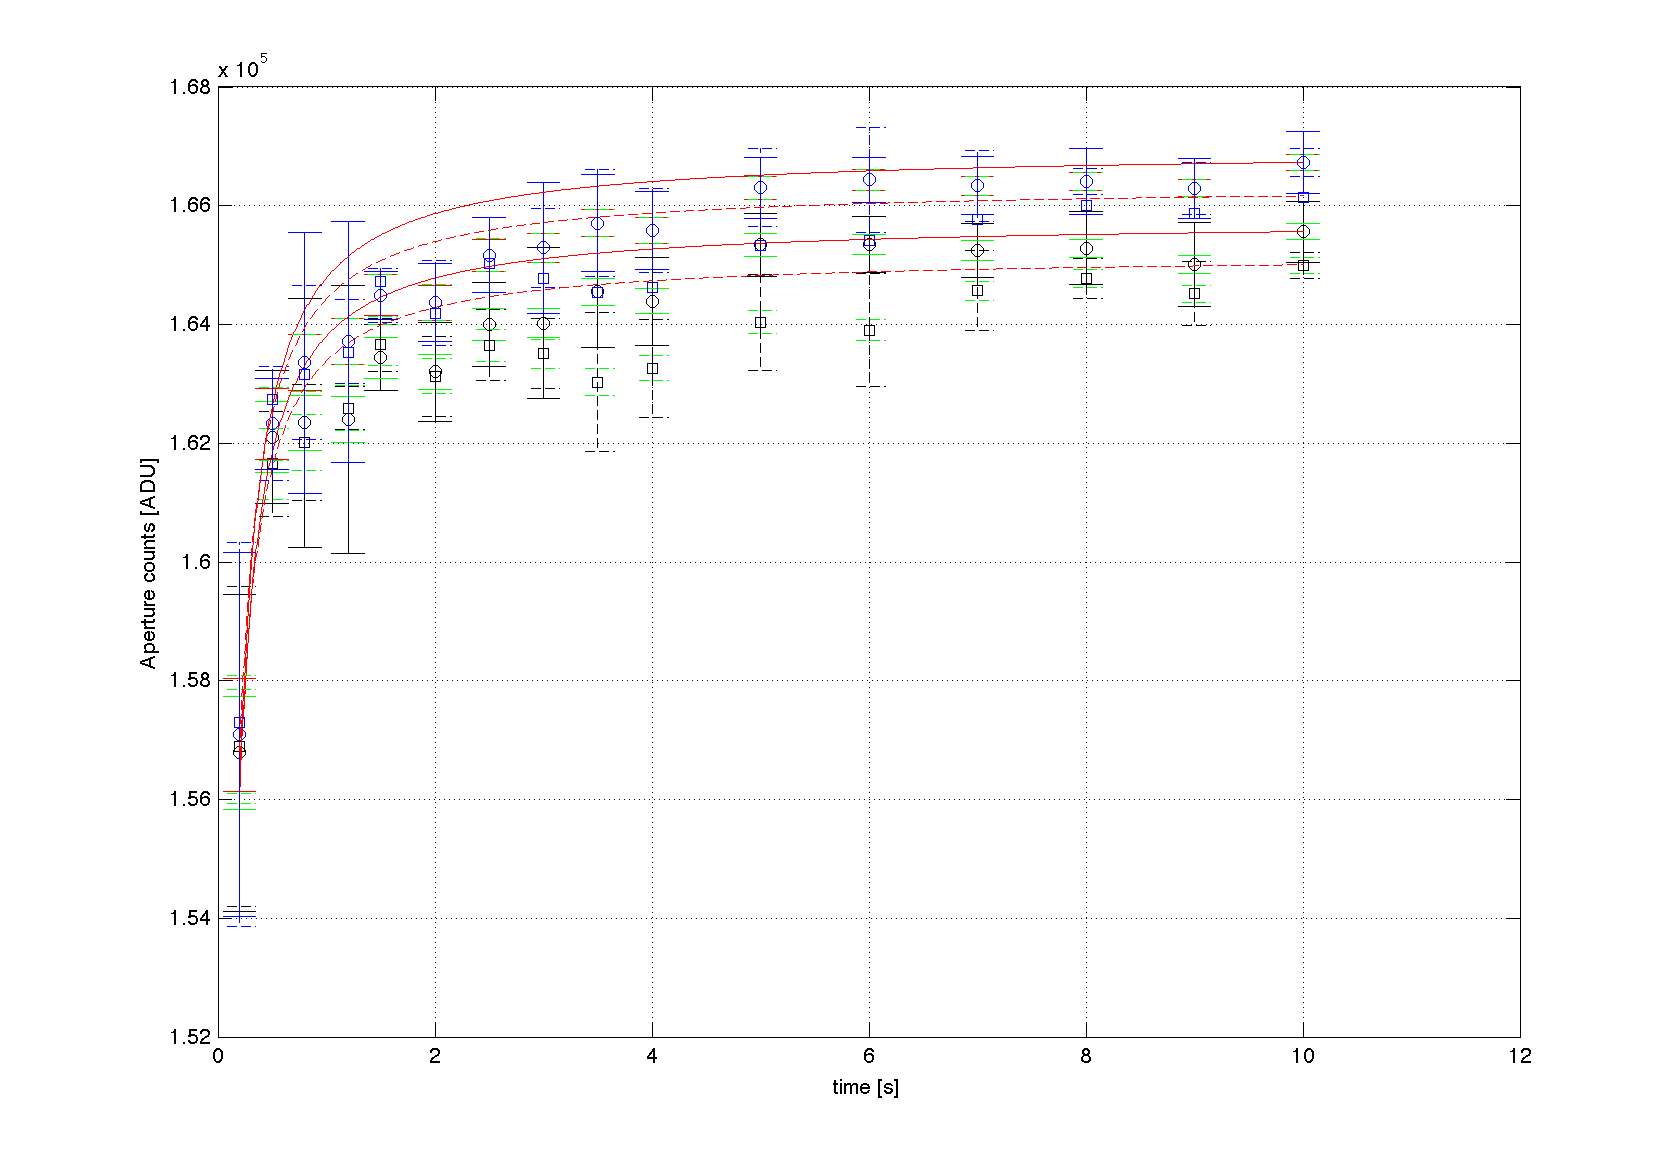
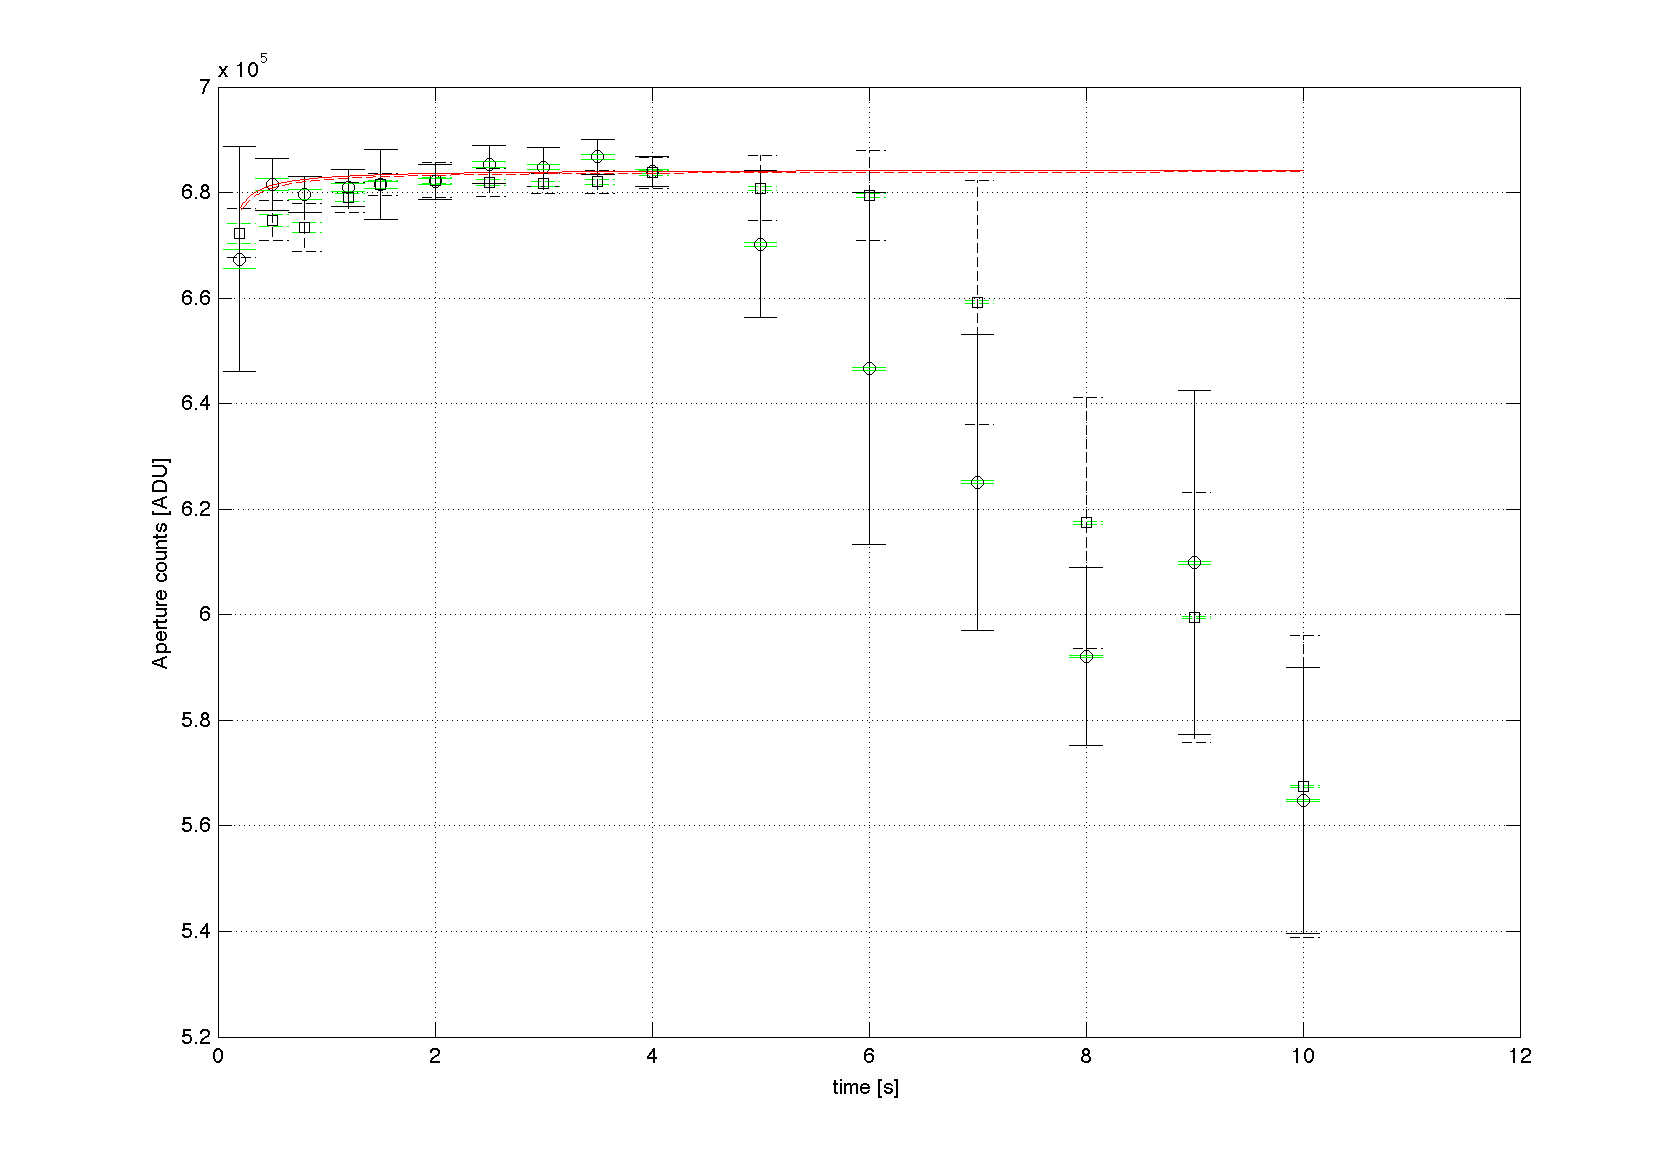
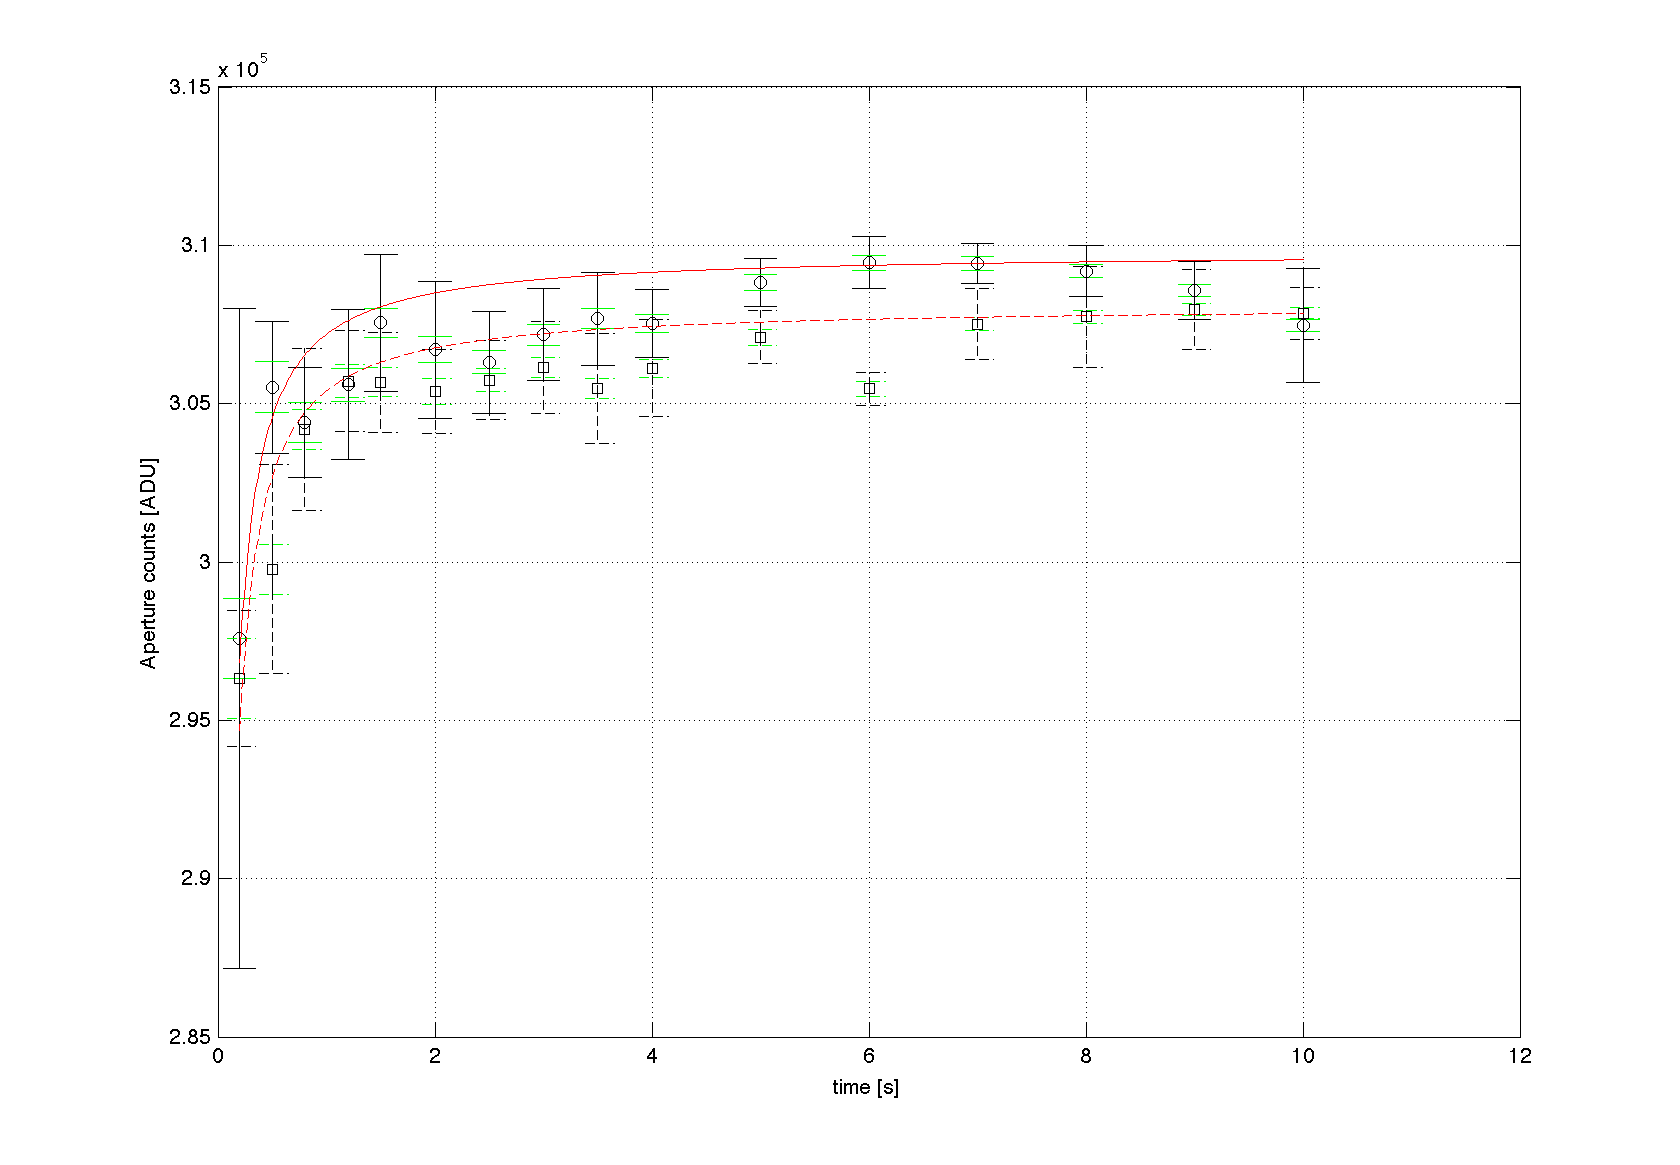
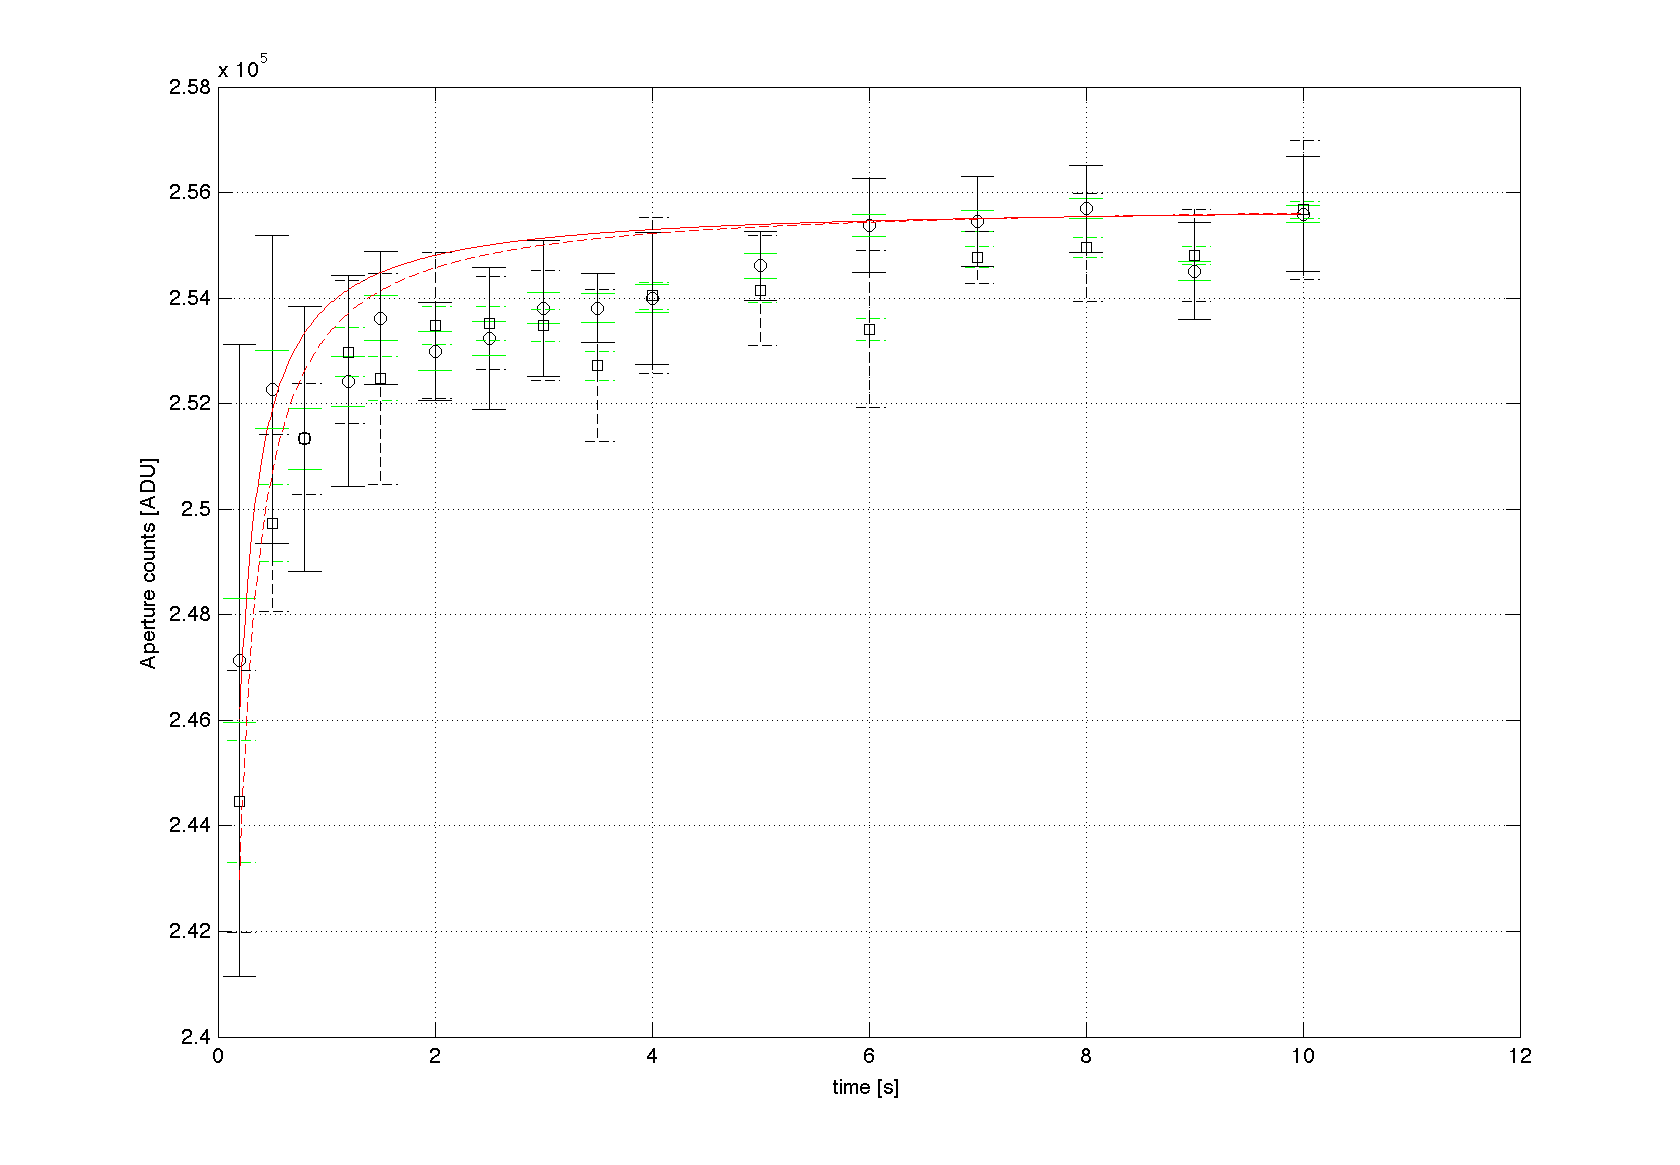
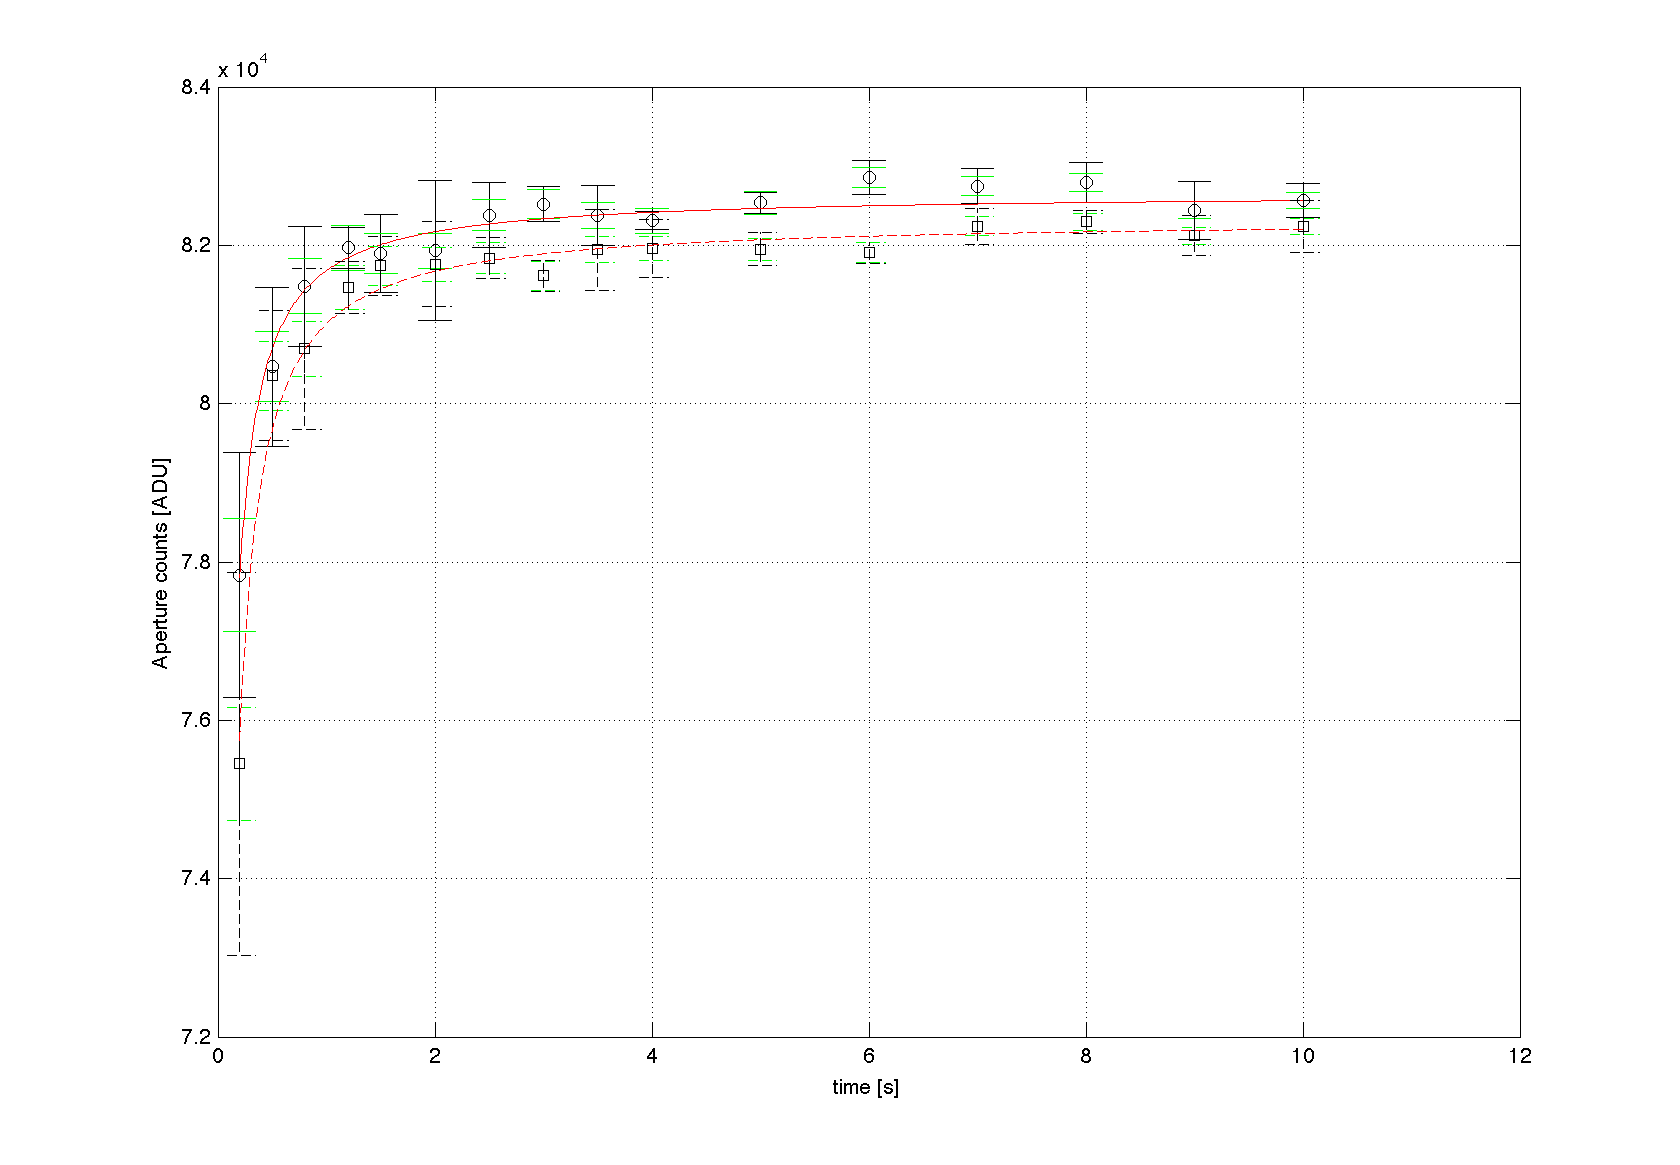
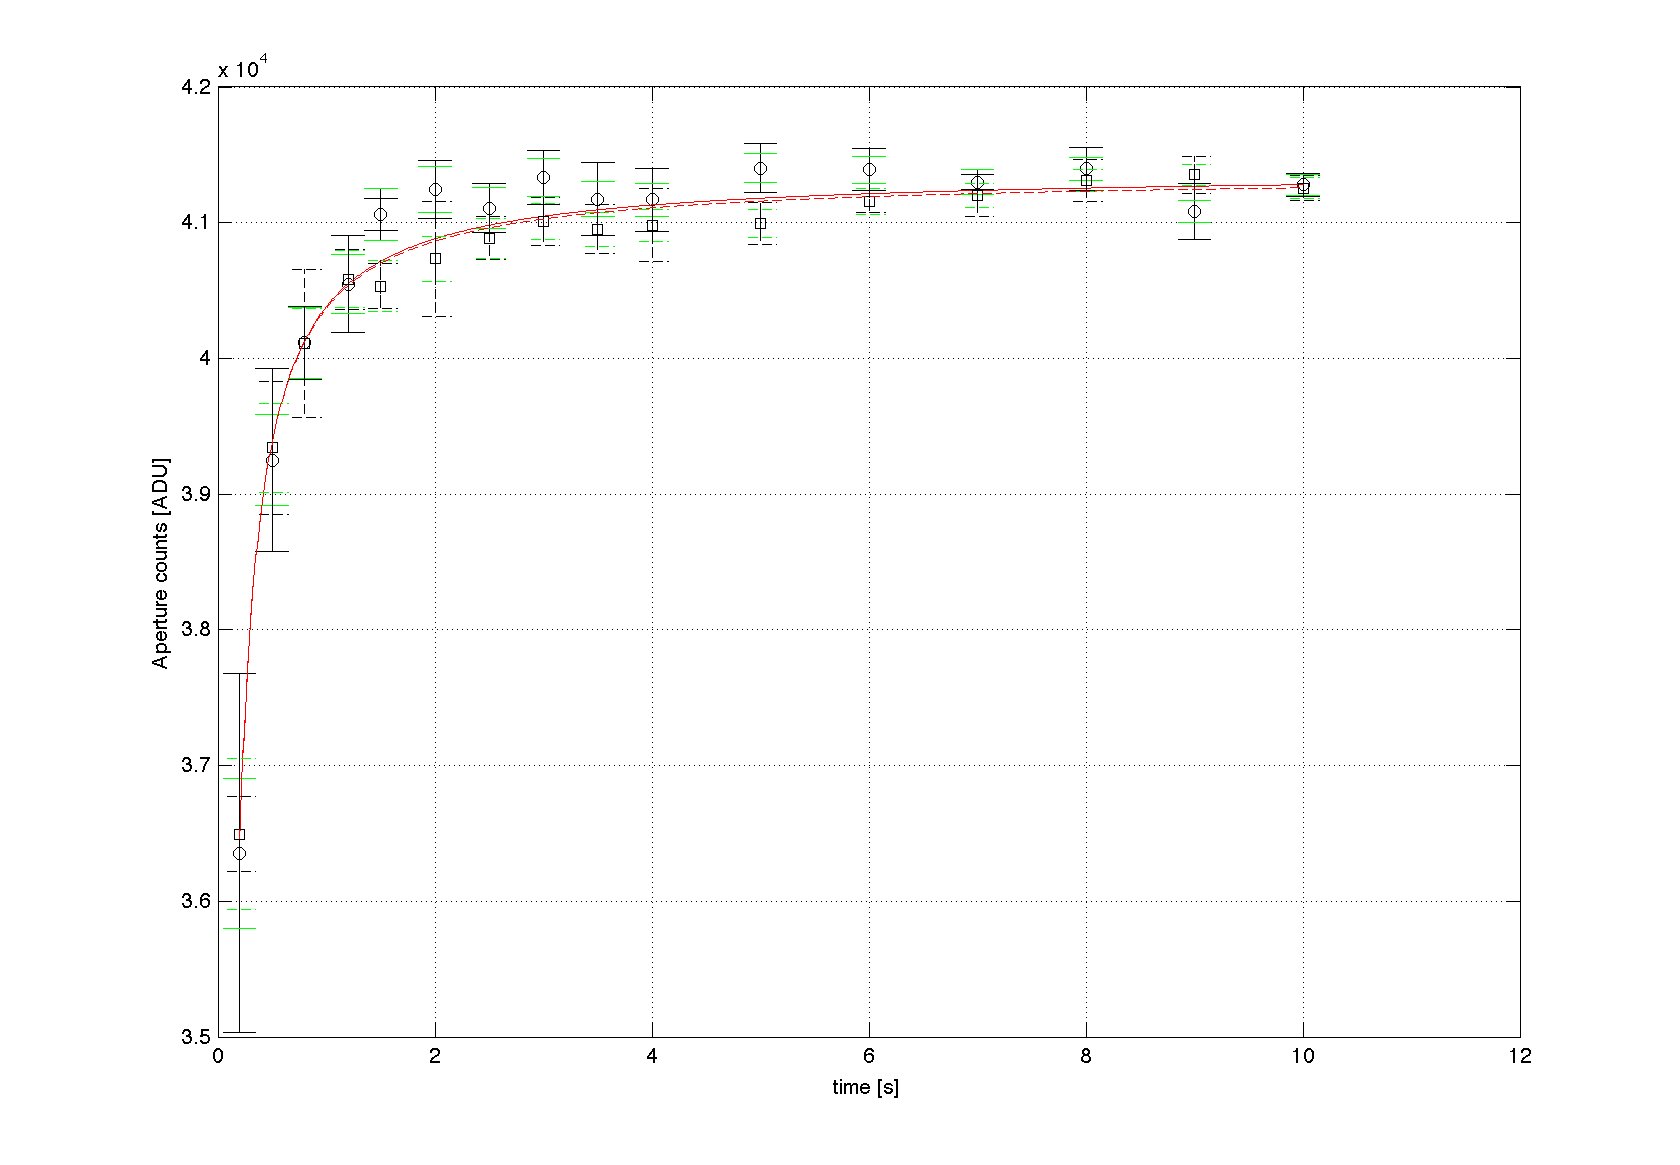
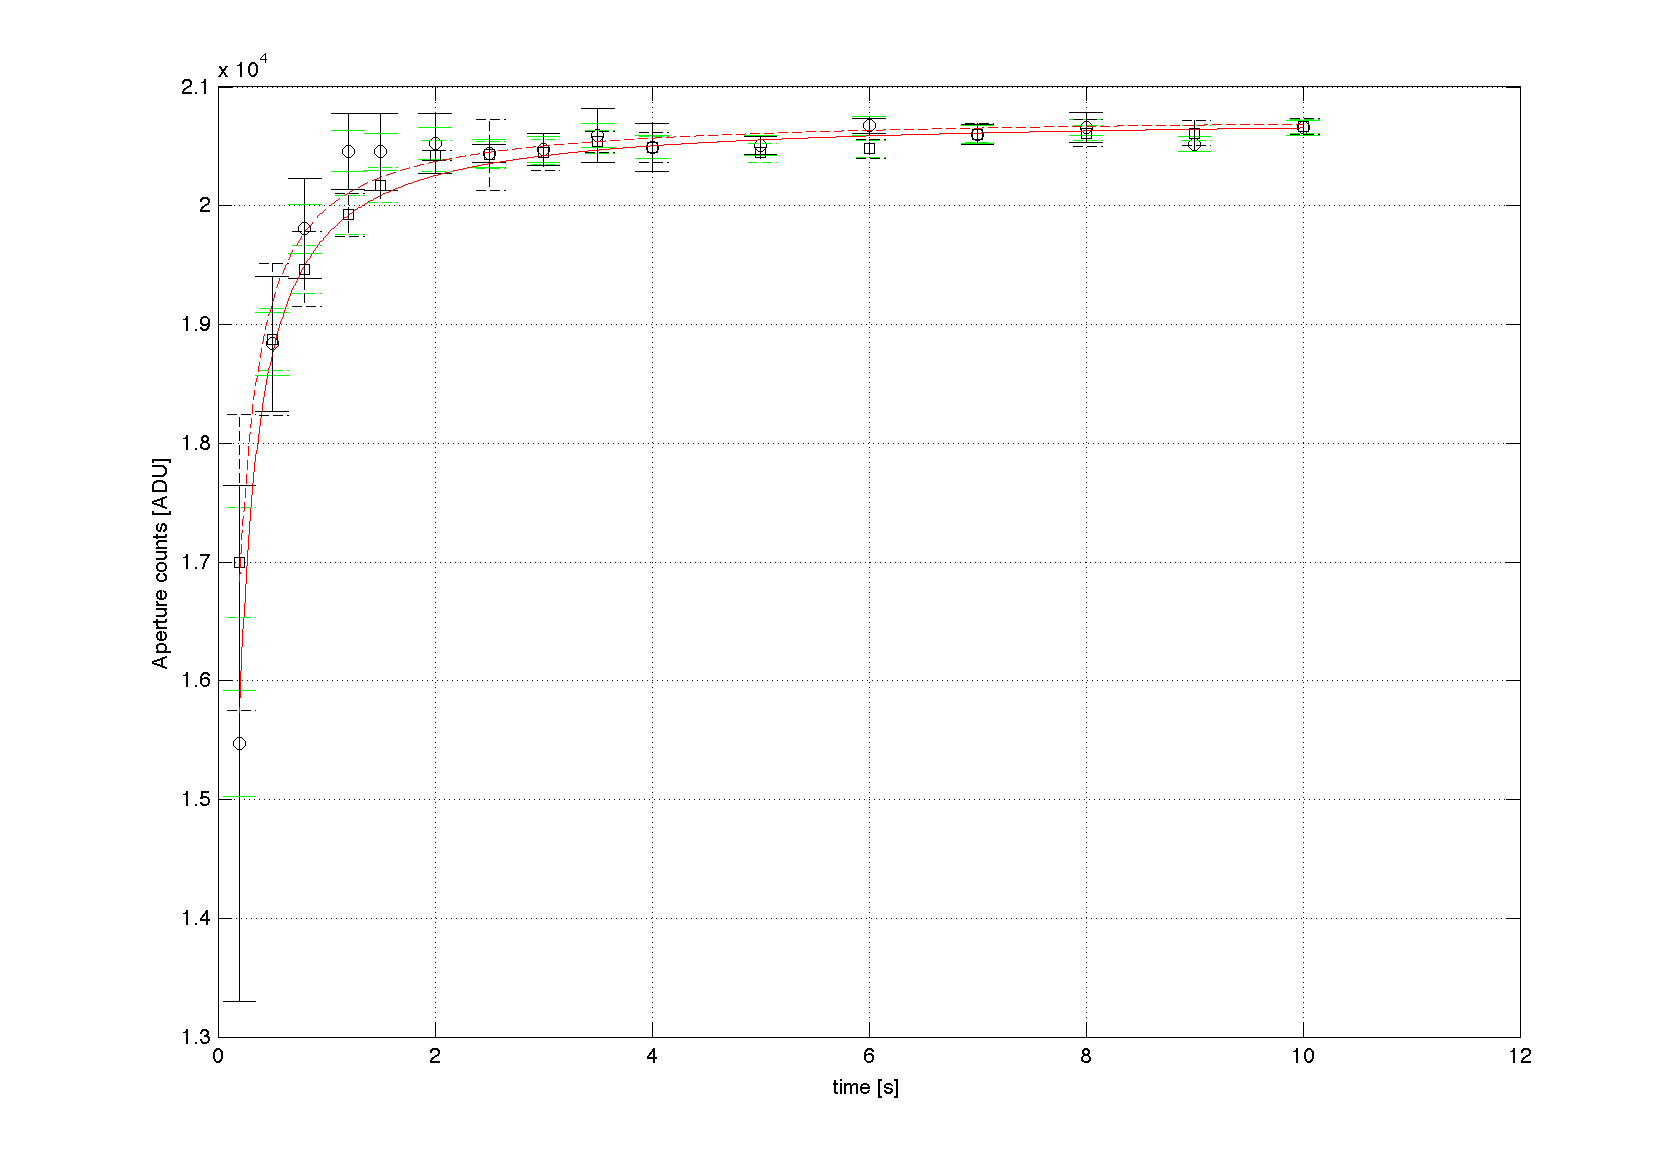
Bias was removed from 60 second darks and scaled to the individual exposure times. The flatfield was taken from the flatfield test earlier in the evening, a combination of the sequences skyA_0 and skyA_180 (50% each normalized) made up the flatfield. This field was taken towards north. There was another field (B) taken to the south but included more stars which would have made some imprints. When the two set of flats were divided the general difference was less than 1000ppm. The flat field images had their own set of darks with the same exposure time as the flats. The slightly elongated stars in the longer exposures comes from a combination of that the telescope was not fully calibrated and an imperfect pointing profile. The telescope was not focused either instead the focus from previous night (18 units) was used. Since the temperature did not differ much from that night the focus was acceptable. Based on the 10 second images an aperture of 15 pixels was selected with a gap width of 24 and an annulus thickness of 10. This was tested so that nearby stars would not end up in either the aperture or the background measurement. However, due to the star density of the field, faint stars in the background measurement could not be avoided completely. Seven stars (see Table 1) was selected. This selection was done considering not to have saturated stars in the 10 second images, have visible stars in the 0.2 second images, be spread over the field, be visible in both the rotation 90 and rotation 270 series, and have a spread in flux (see Fig.1). After the calibration of the images the ADU counts was measured for each of the stars in each image. There were no compensations due to change in airmass since it was considered to be small, nor were images checked for e.g. cosmic rays and artifacts from the BIAS/DARK images. The average background was also estimated in each image. One of the stars (D) was also measured with a larger aperture where the aperture radius had been increased to 19 pixels and the gap width reduced to 20 pixels. This was done to test if the choice of the aperture significantly affected the result. In the rotation 270 images star C and F came near the image edge due to a drift of the field. The stars were always in the aperture but the background estimation came outside of the image in the 0.2-2.5 second images for star F and between 0.2 and 6 seconds for star C. In the Plots. 1-7 the mean of the five measurements for each star and exposure time, were normalized to 1 second. The data from the rotation 90 series are shown in solid lines with data points as circles, while the rotation 270 series are dashed and data points are marked with squares. The black error bars are the standard deviation of the measurements (σn=(Σ(f-f)2/(n-1))1/2). The red error bar corresponds to the mean photon noise i.e. the square root of the sum of the aperture flux and the background flux of the five measurements. Both error measurements are then normalized with the exposure time. If the two types of error differs much then there is something else contributing to the error except for the photon statistics e.g. an uneven shutter delay.The basic assumption for the model fit is that the flux f(t) is a constant (a) multiplied with the (exposure) time (t), but where the time is changed with a constant delay (b) If the results from Eq. 4 and Eq. 3 are put into Eq. 2, then the delay time b in Eq. 1 can be calculated. A negative value of a1 corresponds to that the shutter has a net delay and hence the object is in reality exposed for a shorter time than indicated by the exposure time. The shortest exposure time (tmin) for which the flux reaches X parts of 1 is given by | Result | Although the general trend of the fitted function fN(t) is consistent with with the data there are some clear deviations at the short exposure time end. In most cases the same trend can be seen at the same exposure time for several stars which suggest that the deviation is due to the time recording, or seeing changes, or some other physical reason rather than a measuring problem. However, there is still a general deviation from the assumed model which suggests that there is an additional contribution which is not due to a pure shutter delay. More over, there is a clear trend going from the faint objects to the brighter where the fitted line is below the data for the faint cases and above the data for the bright cases. Because star E has the best correlation between model and data it was used for the recommended exopsure times. Apparently the photon noise cannot account for all of the uncertainty among the brighter stars. On the other hand, the fainter stars are dominated by the photon noise at the longer exposure times but not for the shorter exposure times. This is what could be expected if the shutter delay is not exactly the same every time. The uncertainty deviation for the longer exposure times among the brighter stars is more puzzling but is left for future explanation attempts. Another clear trend is that the data from the rotation 270 is below the rotation 90 data. A plausible explanation is that at least a part of this is due to the slightly lower background background in the rotation 270 series (about 20 ADU/px/s) compared to the rotation 90 situation (about 30 ADU/px/s). This background corresponds to 2.2e5 ADU and 1.4e5 ADU in the aperture at 1s exposure time. in the plot of star D the blue data point from the increased aperture are above the other data due to extra counts coming from additional inclusion of background noise. However, this deviation between the to rotation series does not affect the result in any significant way. In the plots for star A and star B an affect of non-linearity in the CCD can be seen. The effect is slightly delayed in the rotation 270 case because of a lower background. Although this investigations was not aimed at measuring this non-linearity it could be estimated that the effect starts to be noticeable above 50000 ADU. Since none of the measured stars showed actual saturation it is clear that this non-linearity effect is much larger than the errors introduced by the studied shutter delay. The resulting recommendation is to use an exposure time of at least 2s to gain an accuracy of >1% and above 6s to have an accuracy of >0.1% at an ambient temperature of +5 degrees. The 6s limit is also consistent with being within the photon noise of single measurements.
|
| Last update : |